Profiling MiniMax-H3 on GB300 with SGLang and eBPF
In this blog post, on one GB300 tray, I profile MiniMax-H3 end to end. I watch where every second of a clip goes + which serving choices can change without touching the model. Across those experiments the headline is one 12-second clip rendered in 87 seconds instead of 337, at 33% less energy, while the only change was how it is served. And the final clip looked and sounded the same to my human eyes.
11.55-second output · 87.2-second render · 466 kJ
Alright, hi. I just came back from a long holiday. 5 weeks ago, I joined GPU MODE’s AI-assisted kernel development hackathon for fun. And like many of us, I observed how AI explains its (?!) approach. Therefore, to increase my human understanding of AI-written kernels, I was searching for a challenge/tool.
In my previous post, I used eBPF to profile Voice AI on an H100. This time, I profile a joint video-and-audio model. I also wanted a different systems challenge. The server runs on Grace’s Arm architecture and I move closer to CUDA observability by tracing the host path around kernel launches and reading the Grace–GPU fabric counters.
One personal note: the GB300 tray used for these experiments was provisioned by my team at Verda.
TL;DR
-
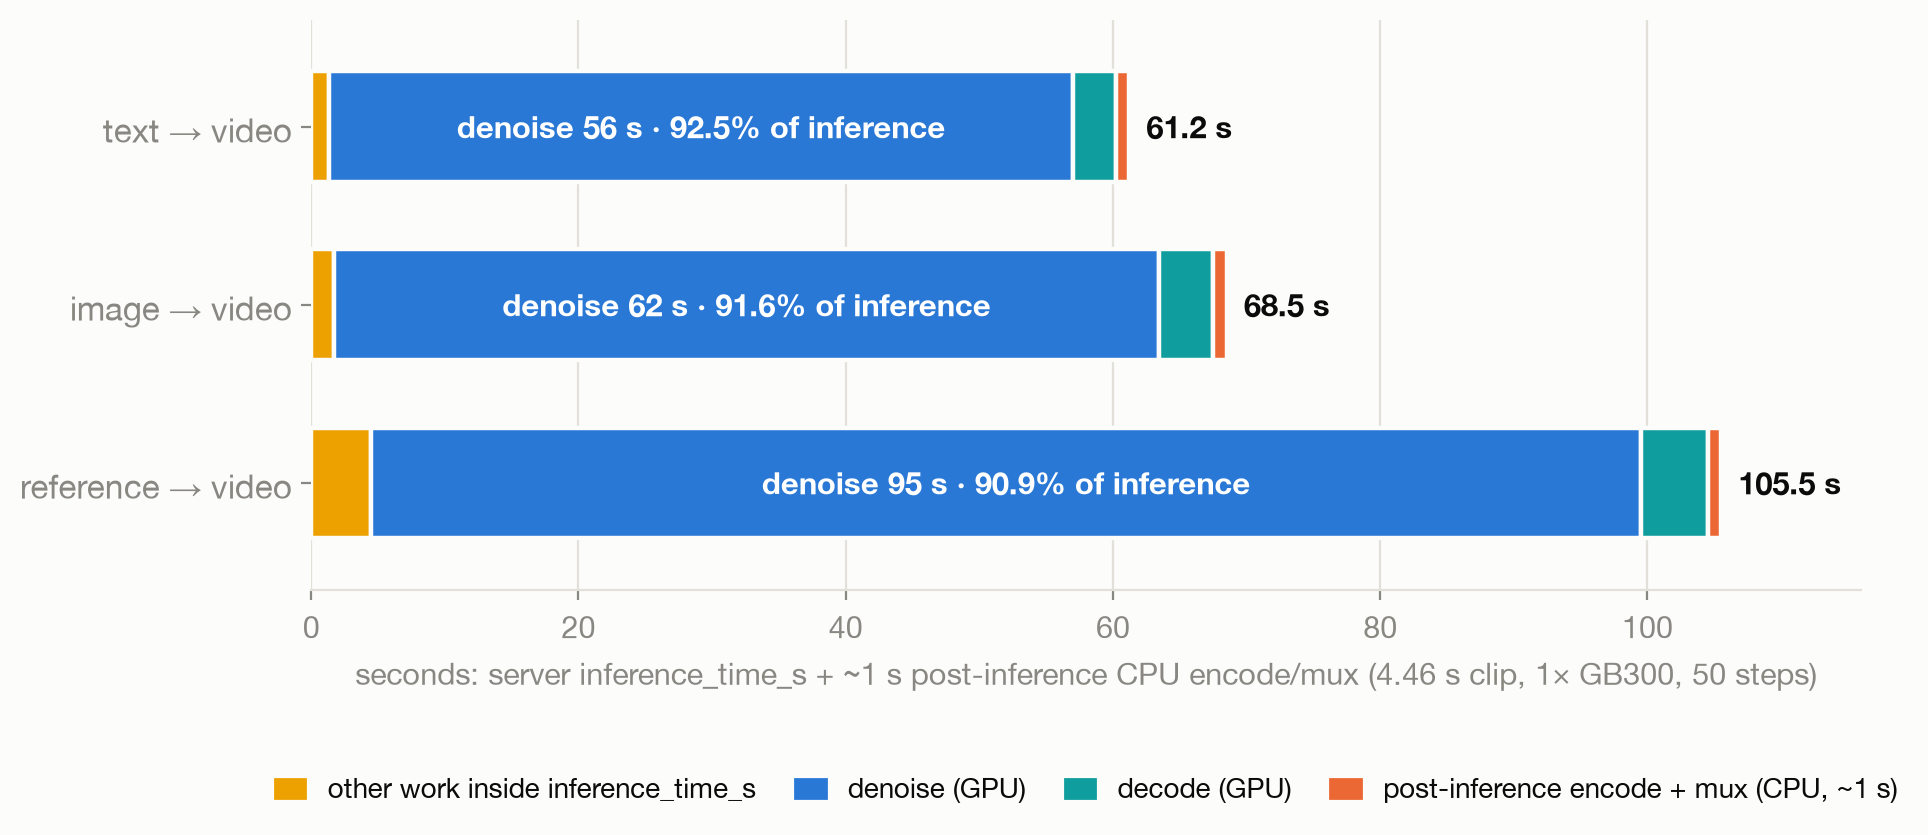
A warm text→video request takes 60.2–60.7 seconds: roughly 56 seconds of denoising, 3 seconds of GPU VAE decode, then about 1 second of CPU H.264/AAC encoding. Input handling and final encoding are only about 2% of the path.
-
Input changes denoising cost, not the short host tail. The same output length takes 60.7 seconds from text, 67.5 from an image, and 104.5 from a reference. Launch counts remain close, consistent with heavier kernels rather than more launches.
-
Ulysses cuts one request from 60.3 to 17.3 seconds across 4 GPUs. With FP8, a 12-second reference clip falls from 336.6 to 87.2 seconds and uses 33% less GPU energy. Faster can also be cheaper when each idle Blackwell Ultra GPU draws about 230 W.
-
Eight concurrent requests do not raise throughput beyond 58.7 clips/hour. This build serves them one by one even with batching enabled; the eighth caller waits 491 seconds for about 60 seconds of GPU work.
-
Grace–GPU fabric traffic spans 4 orders of magnitude: 52 GB/s during weight load, 2.9 MB/s in denoising, and 60 MB/s in decode. The PMU port filter attributes traffic to a GPU, but this tray’s
localandremotelabels are unreliable.
1. Why eBPF and PMUs at the host layer
Most H3 optimization starts inside the model because denoising owns most of the clock; NVIDIA’s Sol Engine finds 3.95× there. I wanted the complementary systems view: what surrounds GPU execution on a live server, and what fixed floor remains as denoising gets faster?
Host uprobes attach to CUDA launch and synchronization functions without changing SGLang. Other eBPF probes cover CPU scheduling and I/O. Grace’s uncore PMUs, read through perf_event_open, expose coherent traffic between CPUs and GPUs without instrumenting the target process. Together they connect request stages, host stalls, power, and fabric bytes while the server keeps running.
This does not replace Nsight or CUPTI. Those tools explain what happens inside kernels; this view explains what happens around them and remains practical for repeated captures on a running service. That distinction matters here because the useful answer is not simply “the GPU is busy.” I also need to know which request stage is busy, what the host is waiting for, and when data crosses the coherency fabric.
What I generated and what each cost
All video and audio in this post are generated with MiniMax H3.
These 3 clips were generated on one GB300: 1024×768 (4:3), 4.46 s @ 24 fps, joint audio (AAC 32 kHz stereo), 50 steps, seed 42, cuDNN SDPA.
1 · Text → video (a 4.46 s clip in 60.7 s)
show prompt
"A golden retriever runs across a sunny meadow, birds chirping in the background."2 · Image → video (a 4.46 s clip in 67.5 s)
show prompt
For the target video, at 0.00 seconds into the target video, <Picture 1> (from [Shot 1]) is fully referenced.integrated_multimodal_description: [Shot 1] Cinematic live-action, natural daylight, a wide shot that starts static then arcs gently. A lone man stands at the edge of a high, windswept rocky overlook, seen from behind, his jacket and hair pushed by the wind — this exactly matches <Picture 1> at 0.00 seconds. From 00:00.00 to 00:01.50 he holds still, the wind tugging at his clothes. At 00:01.50 he slowly turns to his left; as his shoulders come around, the camera arcs left with him at slow speed, revealing more of the landscape that continues beyond the original frame, a wide valley opening out. At 00:02.80 steeper, jagged cliffs rise into view across the valley, taller and sharper than the foreground rocks. By 00:04.00 he settles in profile, gazing toward the distant peaks, hair and collar still lifting in the gusts.overall_soundscape: A strong, open wind sweeps steadily across the overlook, gusting against the man's jacket and rushing over the rocks, swelling as the view opens up; sparse, distant birdcalls drift on the air; a faint scrape of grit under his boot as he turns. No speech.non_diegetic_music: A sparse ambient bed of sustained low strings with a single soft sustained piano note, rising gradually in volume from near-silence to a gentle peak across the four seconds.
3 · Reference → video (a 4.46 s clip in 104.5 s)
show prompt
subject_definitions: <Picture 1>: the provided reference image — a man clad in black plate armour with sharp, angular edges, in low light.summary: reference generation — a new short cinematic clip featuring the subject from <Picture 1>.retention_analysis: <Picture 1>: attribute_transfer — carry over the black angular armour and the low-key night lighting; place the subject in the action below.detailed_description: [Shot 1] Cinematic live-action, night, low-key moonlight from the upper left, an intimate close framing. A man clad in black plate armour with sharp, angular edges — the subject from <Picture 1> — stands in near-darkness, cradling a small white lamb in his hands. Around him, several more lambs stand and mill quietly in the low light. From 00:00.00 to 00:01.50 the camera holds a slow push-in at slow speed on his hands, where the lamb rests; his fingers move gently, stroking the lamb's wool with unexpected tenderness, the cold hard metal set against the warm soft animal, while the surrounding lambs shift and softly call. At 00:01.50 the camera tilts up slowly to his lowered head, a thin rim of light catching the brow of the armour; his posture is careful, protective. At 00:02.80 a faint breeze stirs a few strands of wool, and a lamb at his feet looks up and bleats, while his hands never stop their slow, soothing motion. By 00:04.00 he draws the held lamb a little closer to his chest, a sharp pauldron looming over the tiny soft form, the little flock quiet around him. No speech.overall_soundscape: A hushed night pasture, close and intimate: a soft chorus of gentle lamb bleats ("meee") from several lambs near and far, the faint rustle of wool against metal, the man's slow quiet breathing, and a low breeze in the background. No speech.non_diegetic_music: A slow, sparse, warm bed of a single soft piano and sustained low strings, played quietly and legato, rising gently across the four seconds.
Here is where each second goes:
How everything here was measured
The system is one GB300 NVL compute tray: 4 Blackwell Ultra GPUs, 2 Grace CPUs, 956 GB RAM, and a local 4× NVMe RAID5 for weights. It runs 64 KB pages, driver 595.71.05, CUDA 13.2, and kernel 6.14.0-1013-nvidia-64k. Its 2 NUMA sockets pair CPUs 0–71 with GPU0/GPU1 and CPUs 72–143 with GPU2/GPU3. Every GPU has near and far host memory, and every uncore counter has 2 instances. numactl -H listed 34 nodes; the 32 GPU-memory nodes reported 0 MB.
MiniMax-H3 is a 33B dense omni-transformer that generates video and audio together. I serve it with SGLang Diffusion (≥ 0.5.17) in enroot:
sglang serve \ --model-path /data/models/minimax-h3 \ --model-variant fl2va \ --num-gpus 1 \ --ulysses-degree 1 \ --performance-mode speed \ --port 30010The baseline keeps H3’s DiT in eager PyTorch without torch.compile; PyTorch selects dynamic_cudnn_sdpa on GB300. Latency is the server’s inference_time_s. Unless stated otherwise, runs use BF16, 1024×768, 4.46 seconds at 24 fps, joint audio, 50 denoising steps, seed 42, and one GPU. Extra GPUs are introduced only as experiments.
The pipeline has 5 stages. Startup loads weights and JIT-compiles kernels. A request begins with input ingest, then H3 repeatedly turns noise into joint video-and-audio latents through denoising. The GPU VAE converts video latents into frames, and Grace encodes those frames as H.264 and muxes the AAC audio. Denoising and VAE decode run on the GPU; ingest and final encoding are host work. This GB300 has no NVENC [6], and I measured 0% GPU use during final encoding. Keeping these boundaries explicit prevents the server’s single latency number from hiding a fixed CPU tail behind a long GPU stage.
Headline results discard the cold run and report 5 warm runs (standard deviation roughly 0.04–0.14 seconds). Each denoising-step point also has 5 runs; the 3 input modes and 12-second clip have 3 each. Concurrency has one run at 1, 2, 4, and 8 requests in flight and is labelled accordingly.
The tray is otherwise idle, automatic NUMA balancing is disabled, and no throttling flags are active. I read fabric counters once per second through perf_event_open; pmu_fabric.py corrects two-socket and per-GPU values for multiplexing. I did not isolate PMU-reader overhead, but launch uprobes added 1.1%. I keep the standard 1,400 W limit because the requested GPU clock did not hold under load.
2. Cold start isn’t where you think
Weight loading was not the largest cold-start cost. Run:ai Model Streamer bypasses mmap and page faults; from a warm page cache it moves 53.1 GiB of the roughly 63 GB BF16 text encoder at 53.9–70.4 GiB/s. All 6 modules load in 19–21 seconds. SGLang reports 112–124 seconds with 8 GPUs, where per-rank bandwidth suggests a shared-path bottleneck, although I did not isolate storage contention.
The text encoder moves directly to cuda:0 at 53.9 GiB/s. The transformer reaches a 62 GB CPU buffer at only 7.0 GiB/s, 7.7× slower, before its GPU copy. That host-staged path is the first cold-start target.
Ranks do not scale loading proportionally. Across 4 ranks, text-encoder bandwidth falls from 41.3 GiB/s to 23.8, 12.2, and 12.1 GiB/s; the host-staged transformer falls from 7.0 GiB/s alone to 6.6, 6.5, 5.4, and 5.0 GiB/s. Adding ranks creates more consumers of the same read path rather than multiplying its bandwidth.
A fresh single-GPU server needs about 104 seconds: 30 for Python/CUDA initialization, 21 for modules, and 52.5 for warmup. An nvidia_cutlass_dsl warning for FlashAttentionForwardSm100 places JIT compilation inside the largest block. A later warm-cache warmup took roughly 16 seconds, but this was not a controlled cache-only comparison or complete startup. Because Model Streamer bypasses mmap, I measure reads rather than filemap_fault activity.
3. How I measure: eBPF at the host layer
A uprobe is a temporary hook on a userspace function. I attach from the host, outside the container, and aggregate timestamps rather than changing SGLang or rebuilding its image. That makes short, repeated captures possible on the already-warm server.
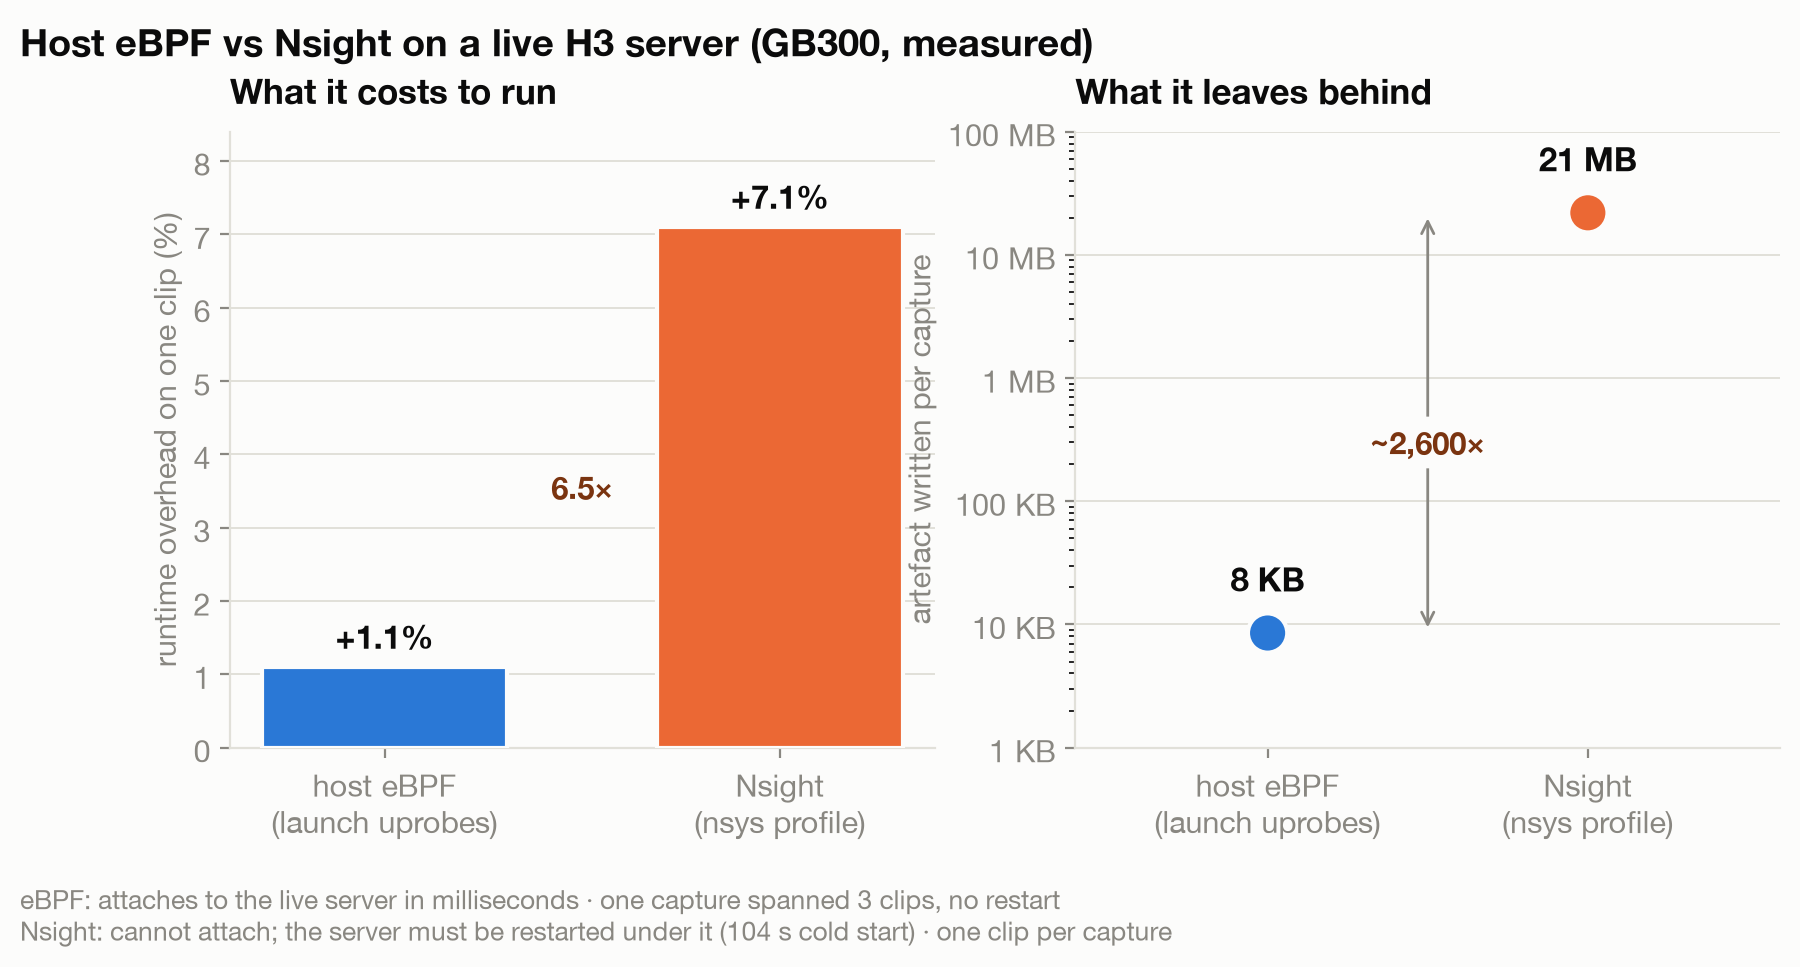
I first tried Nsight Systems, but the command-line modes in nsys 2025.6.3 and 2026.4.1 restarted the target, adding the 104-second startup. Uprobes attached in milliseconds, added 1.1% overhead, and exposed the 1.2-second gap investigated in section 5. Nsight still provides the deeper kernel view; eBPF is the lower-overhead instrument I can leave close to the live serving path.
Arm64 uprobes have been associated with single-step corruption, but a CUDA canary survived 730,000 probe hits on kernel 6.14.0-1013. I still time-box them and use hardware counters for fabric measurements.
CUDA exposes 4 launch symbols; only 2 were active. One clip used cuLaunchKernel 59,181 times and cuLaunchKernelEx 62,797 times, roughly 122,000 launches total. Both _ptsz variants stayed at zero.
4. The per-request timeline
A CUDA launch is the host asking the GPU to run a kernel. Launch rate alone does not identify a bottleneck, but its shape resolves the stages of one 60.7-second request:
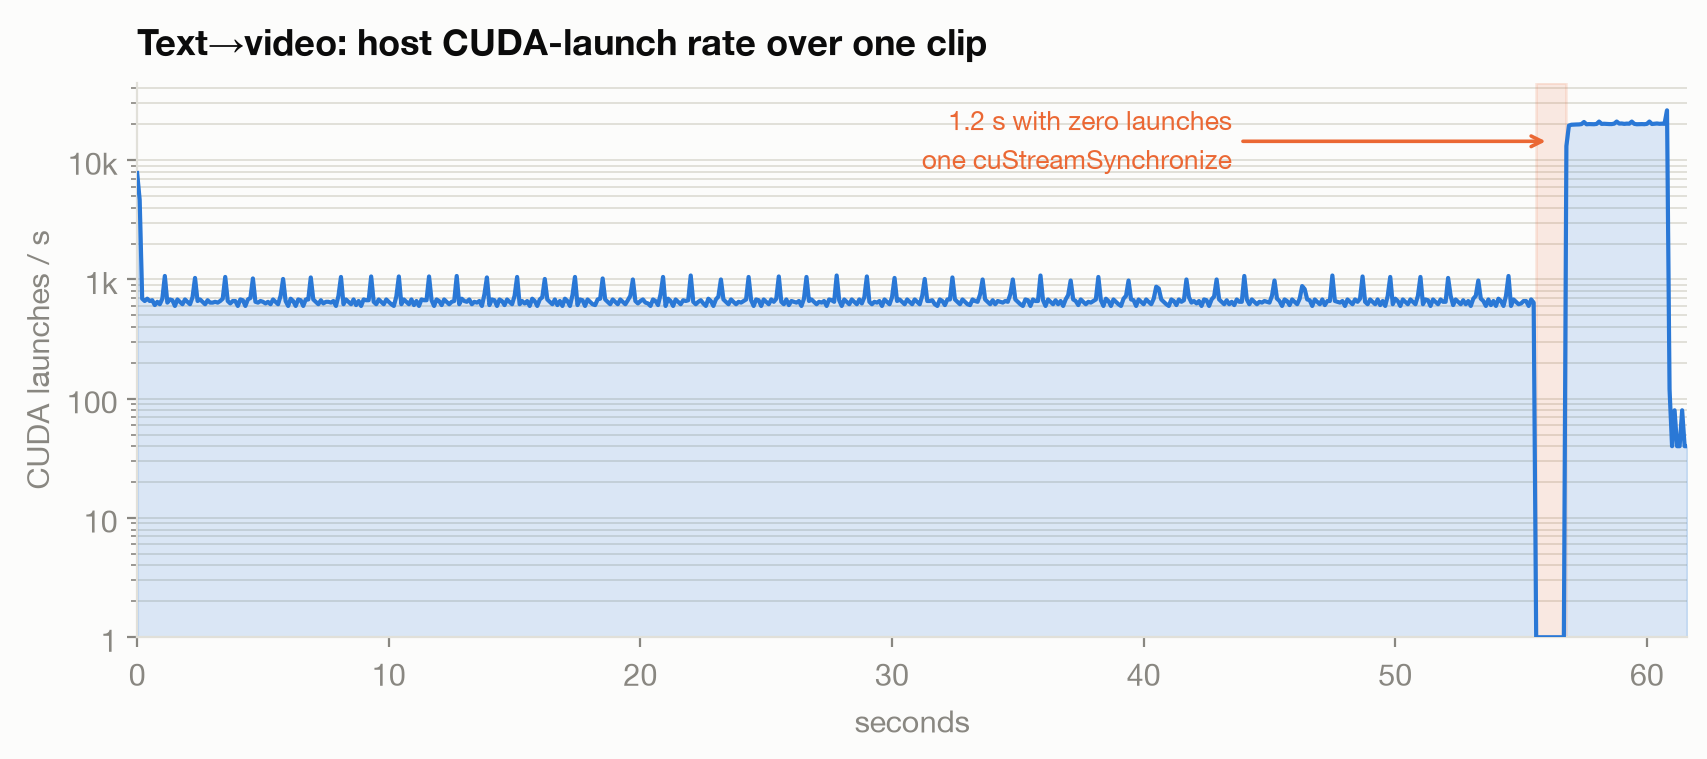
The first second contains 1,771 launches from the text encoder, followed by a ~55-second denoise plateau at ~690 launches/s. Before second 57, VAE decode jumps to ~20,000 launches/s for roughly 4 seconds. Launches then approach zero while Grace encodes H.264/AAC for ~1 second at 0% GPU use. Denoise owns time, VAE decode owns launch rate, and CPU encoding disappears from a GPU-only view.
That contrast is why launch count needs timing context. Decode launches far more kernels per second than denoise but finishes much sooner. A raw total would make decode look dominant even though denoise determines latency.
5. Launch cadence: is it launch-bound?
I first suspected an eager DiT dispatching from one Grace core might be launch-bound. Inter-launch gaps say otherwise:
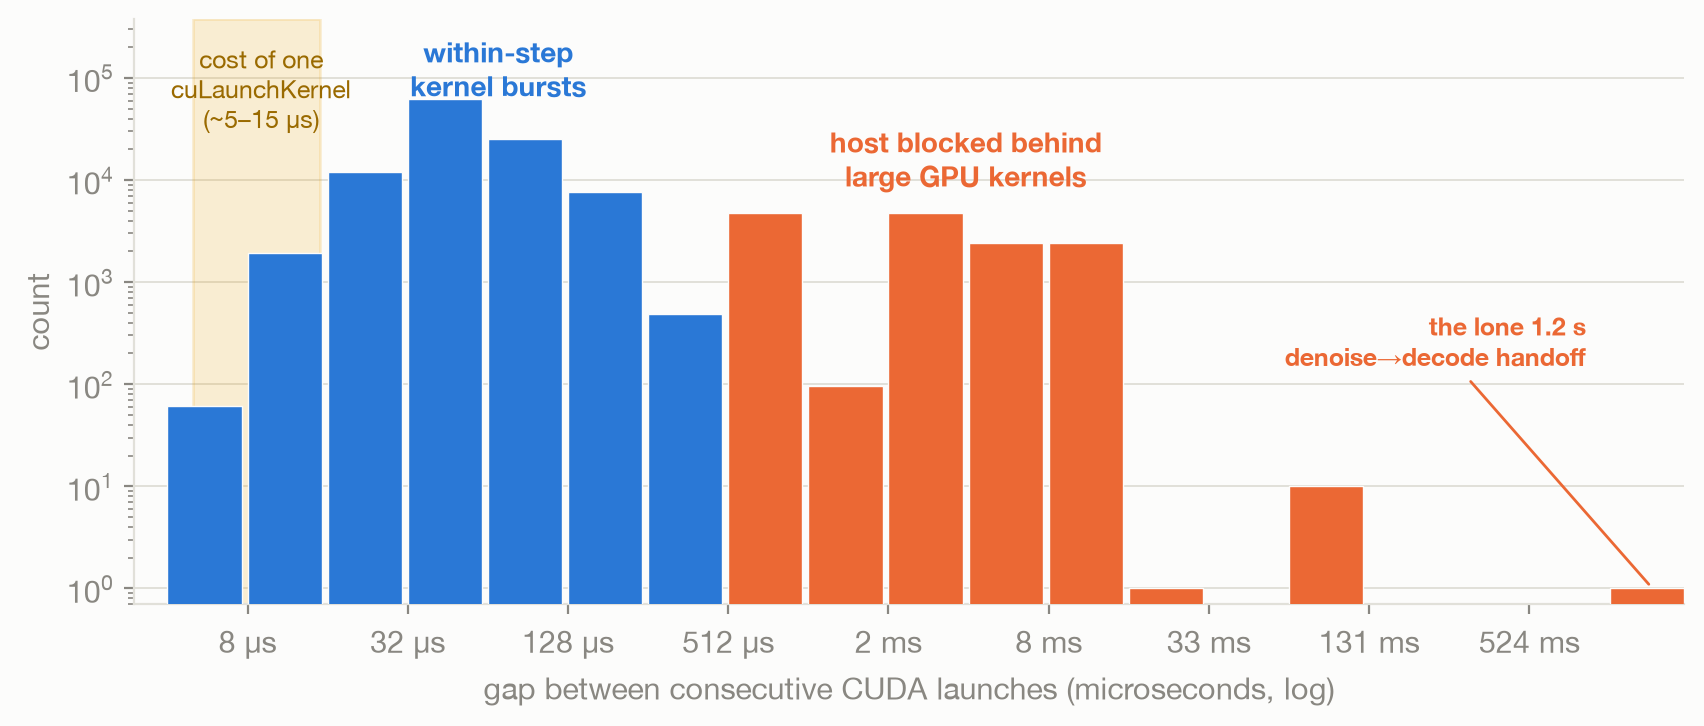
Across 124,859 gaps, most are 16–256 µs and a smaller mode is 0.5–16 ms. The ~14,000 long gaps cannot be only 50 step boundaries. They are consistent with the launch thread waiting for attention/GEMM work, but inter-arrival time cannot prove attribution. Median gap is 55 µs; 690 launches/s averages both modes to 1.45 ms.
The biggest host-side stall in a request is one function call
The clearest absence is 12 consecutive 100 ms bins between denoise and decode: 1.2 seconds with no host dispatch. A return uprobe on cuStreamSynchronize, printing only blocks over 50 ms, produced exactly 2 lines across a multi-clip capture:
t=19152 ms blocked 1234 ms tid 1793496t=80312 ms blocked 1228 ms tid 1793496The calls are 61,160 ms apart, once per clip on the same thread, ~1.23 s each; no other cuStreamSynchronize exceeded 50 ms. The host waits at the denoise→decode handoff while prior stream work completes, matching the framework log. It is only 2% of the clip, but now it has a name.
Across the 3 input modes the gap is 1.2, 1.3, and 2.5 seconds, or 2.1–2.6% of DenoisingStage. Under Ulysses SP4, the longest zero-launch run is 0.2 seconds, below my 0.5-second threshold.
About 98% of gaps exceed 16 µs, but device state is stronger evidence: denoise holds 100% and ~1,370 W near the 1,400 W cap. Lowering the cap moves clip time with SM clock (60.1 s at 1,611 MHz → 77 s at 1,252 MHz) while HBM stays at 3,996 MHz. This is consistent with compute-bound work; only an NCU roofline would confirm it. CPU encode drops the GPU to 0% and ~235 W. Because Grace has no RAPL, energy uses nvidia-smi module power.
SGLang’s cookbook supports this from another direction: torch.compile and a breakable CUDA graph reduce launch overhead but show no measured speedup.
6. Why some inputs cost more
The same 4.46-second output can require different work. Denoise dominates text, image, and reference clips (92.5% / 91.6% / 90.9%) and grows with conditioning. Image→video adds its first frame to the packed attention context; reference→video uses a separate Ref2VA transformer for identity and style. In both, extra time lands in denoise rather than input encoding.
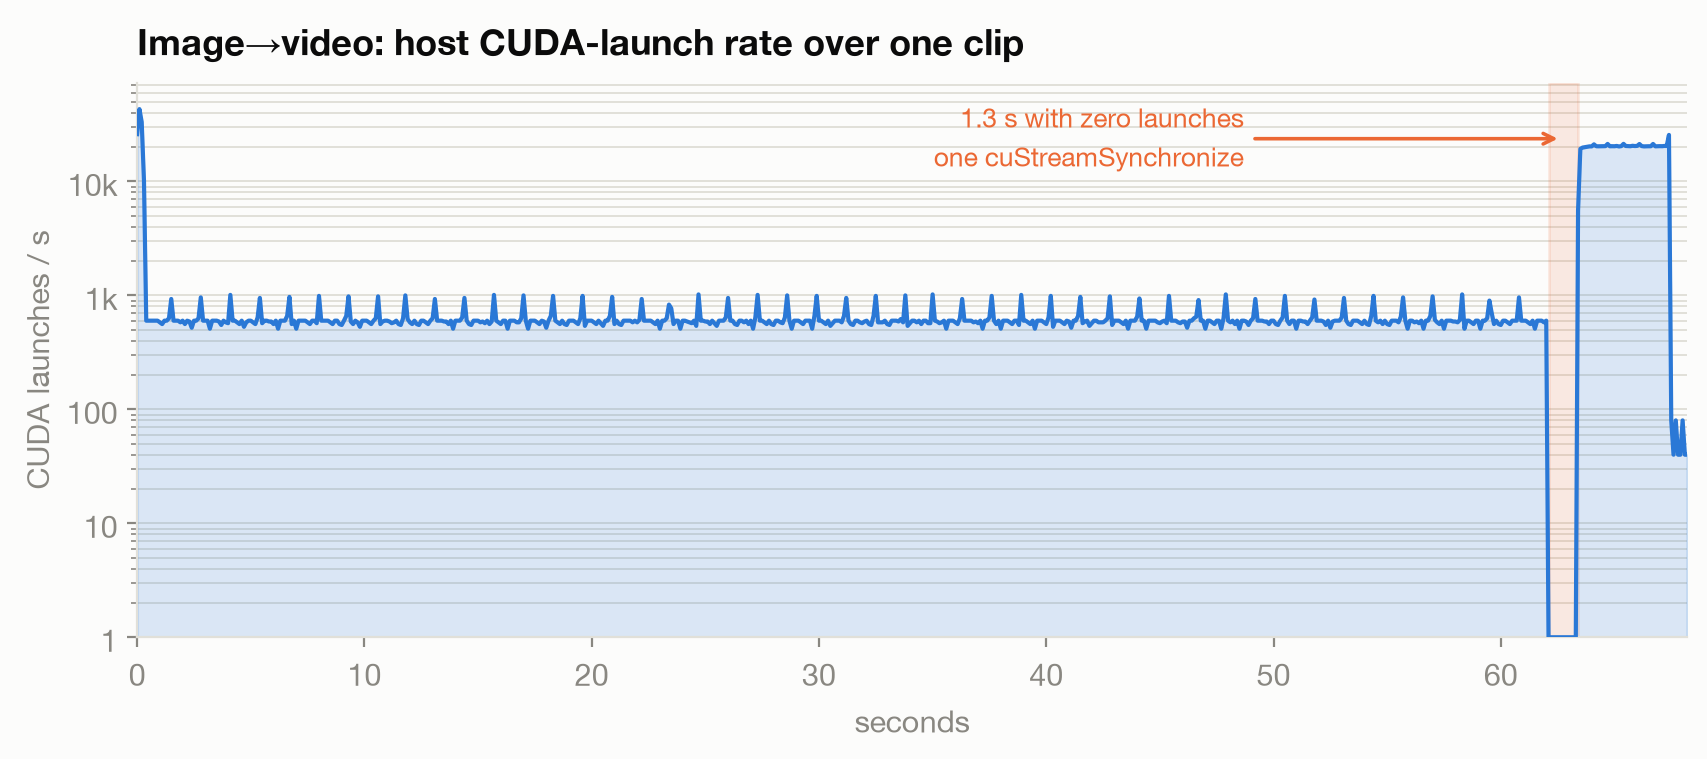
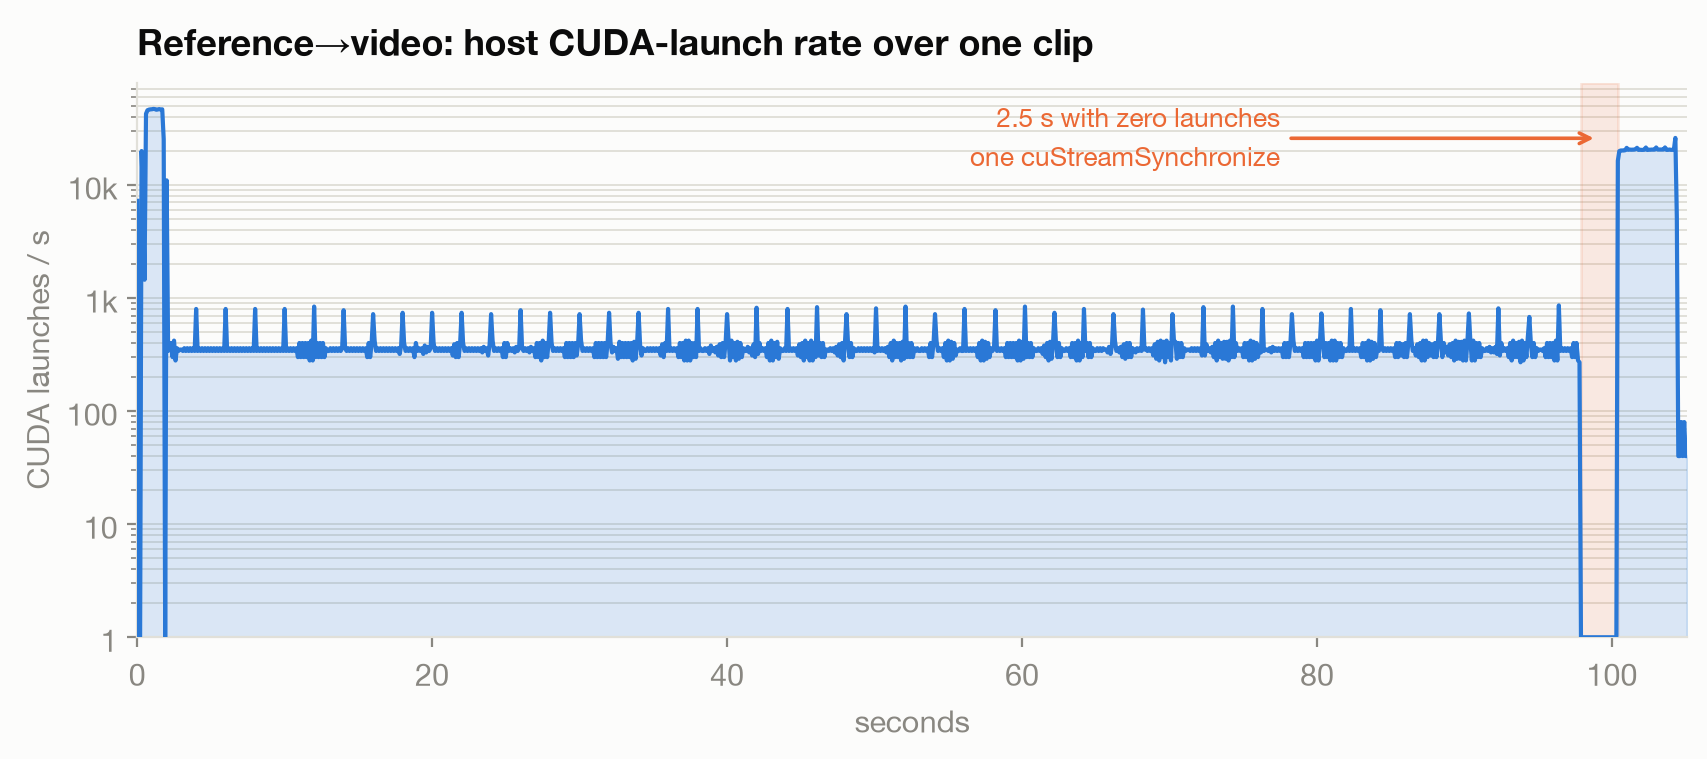
Image encoding takes 0.169 s, while denoise grows from 55.7 to 61.8 s. Reference→video denoises for ~95 seconds: each step is ~1.7× heavier, with the GPU at 100% / ~1,390 W. Decode and output encoding remain near 4–5 and 1 second.
I repeated each mode at n = 3 and metered all 4 GPUs:
| mode | inference_time_s (n = 3) | energy per clip | peak per GPU |
|---|---|---|---|
| text → video | 60.94 s ± 1.09 (warm runs 60.2) | 124.0 kJ ± 0.7 | 122,924–129,568 MB |
| image → video | 68.43 s ± 2.16 (warm runs 66.9) | 138.8 kJ ± 2.5 | 123,316 MB, identical ×3 |
| reference → video | 103.64 s ± 0.08 | 213.0 kJ ± 0.1 | 125,752–131,844 MB |
After warmup, reference→video repeats within 80 ms; first text and image runs take 2–5 seconds longer to settle. Energy follows runtime: 124 kJ for text, 139 kJ for image, and 213 kJ for reference, 72% more than text for the same output length.
Denoising uses about 37k launches for text, 38k for image, and 34k for reference, while time grows from 56 to 62 to 95 seconds. This is consistent with more work per kernel, not more launches. Because prompts, inputs, and checkpoints differ, these are representative workloads rather than proof that conditioning alone causes the difference.
7. Validation: checking the trace against SGLang
I checked eBPF boundaries against SGLang’s stage timers. Text→video reports 0.15 seconds of text encoding, 55.69 of denoising, a 1.23-second synchronization gap, and 3.18 of VAE decode. Their 60.25-second total is 54 ms from the server’s 60.196-second inference_time_s; final CPU H.264/AAC encoding occurs afterward and adds about 1 second.
This is a sanity check, not an independent GPU measurement: SGLang does not synchronize CUDA at every boundary. eBPF adds queue time, the host synchronization gap, launch shape, and final CPU encoding.
The 49/49 log is expected: a 50-point noise schedule ends at zero, so the model runs 49 denoising evaluations.
8. What could be changed on the infra layer
Host knobs did not move latency: AutoNUMA-off reduced fabric work, explicit binding was flat, and GPU placement moved 0.24 seconds. Serving flags mattered because denoise owns 92% of baseline.
Ulysses: latency first
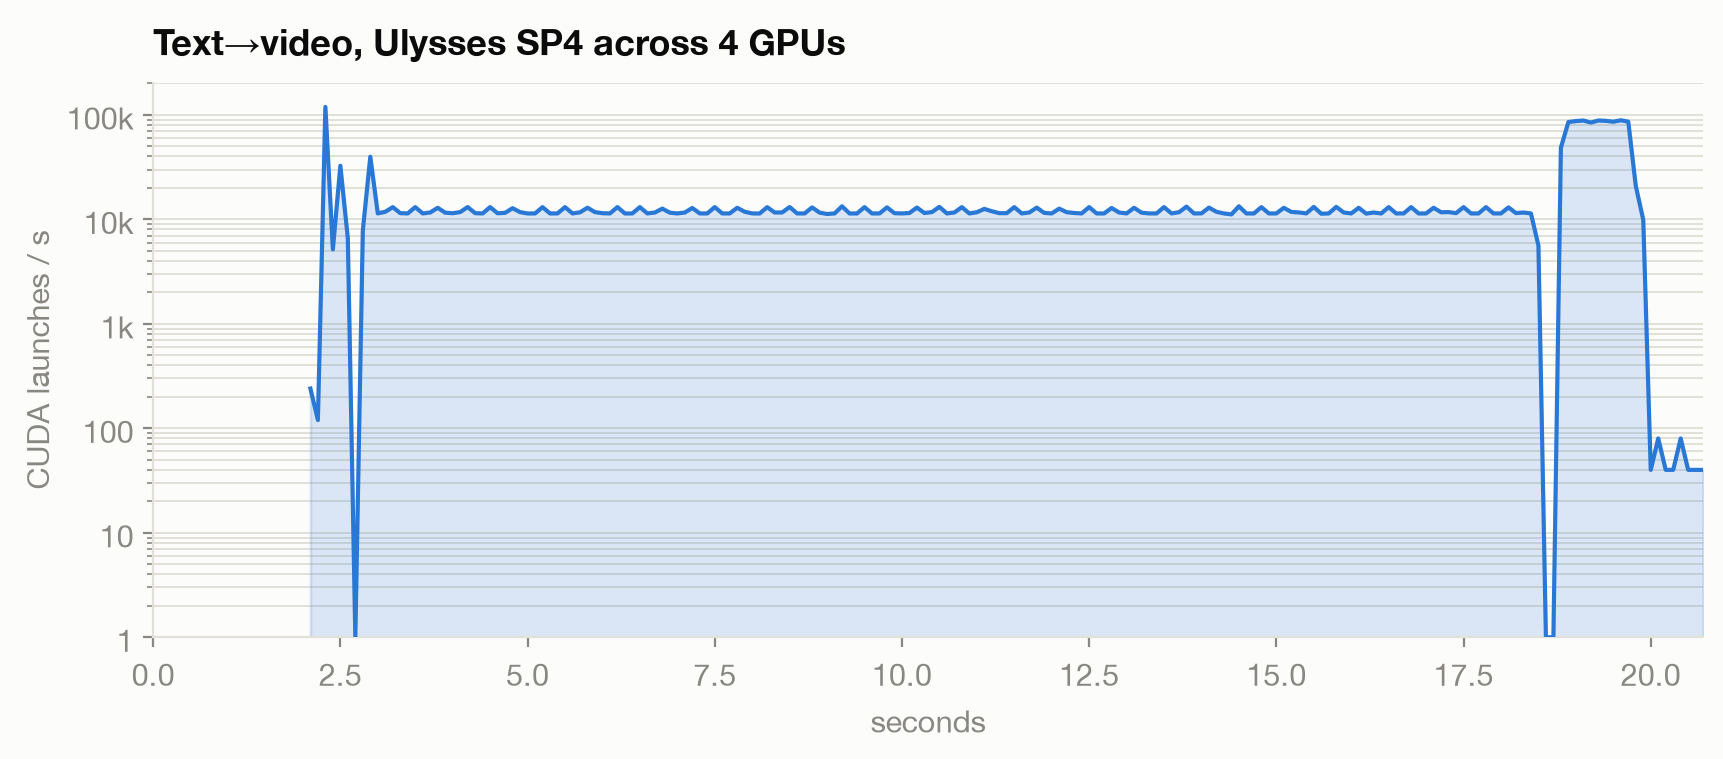
Ulysses splits the token sequence across 4 GPUs and uses all-to-all exchange for attention. With --num-gpus 4 --ulysses-degree 4, 5 warm runs fell from 60.29 to 17.31 seconds (3.5×) with standard deviation below 0.05 seconds.
Each GPU computes one sequence slice, then exchanges the pieces needed by attention. This keeps the output specification and denoising step count unchanged: it is a parallelism experiment, not a quality shortcut. The trade is that one request now occupies the whole tray.
Prompt, seed, 50 steps, and attention math stay fixed, although GPU count changes floating-point reduction order. The sample remained close (LPIPS 0.044); SSIM 0.76 compares 2 valid samples rather than grading quality. SP4 buys latency, not free throughput: 69 GPU-seconds versus 60.3 on one GPU. Inference time projects 208 clips/hour and submit-to-done measured ~195. Four independent one-GPU streams project ~235–239, but I did not run them together.
One rendering GPU drew near 1,370 W while its 3 idle neighbours used 689 W. I therefore integrated all 4 GPU power domains. CPUs, NVSwitches, DPUs, and PSU losses are excluded; rack energy is higher.
| path | inference | metering window | 4-GPU domain power | energy per clip |
|---|---|---|---|---|
| one GPU, 3 neighbours idle | 60.9 s | 62.6 s | 1,982 W | 124.0 kJ ± 0.7 |
| Ulysses SP4 | 17.3 s | 18.5 s | 4,855 W | ~90 kJ |
| 4 independent single-GPU streams | projected | not metered | 5,172 W | 79 kJ |
The first 2 rows integrate matching submit-to-done windows. The unrun 4-stream row extrapolates measured busy-GPU draw. SP4 used 27% less energy, 90 versus 124 kJ; four streams project ~12% less at 79 kJ. Fill idle GPUs with work or spend them on latency.
Under SP4, host launch rate rises from ~690/s to ~12,000/s with host-dispatched collectives. All 4 GPUs reach 100% near 1,360 W; sequence sharding lowers peak memory from 123 to 95 GB.
What happens when 8 people ask at once
I sent 1, 2, 4, and 8 text→video requests concurrently.
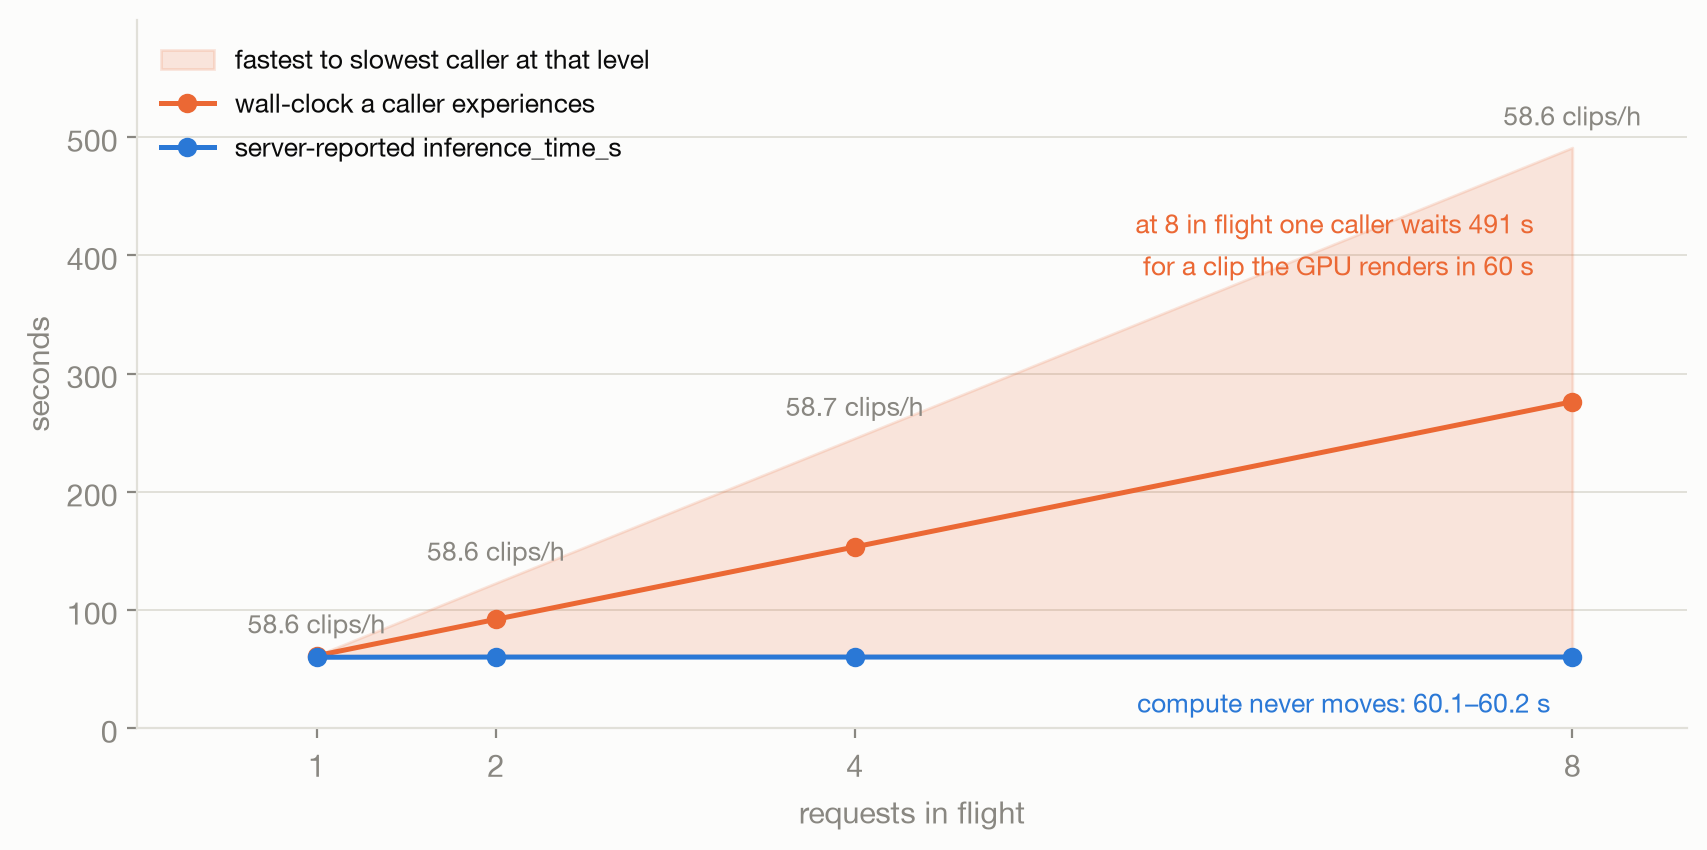
Throughput stays at 58.6–58.7 clips/hour. inference_time_s is 60.18, 60.18, 60.20, and 60.29 seconds at n = 1, 2, 4, and 8, with σ = 0.13 seconds at the busiest. Extra callers wait FIFO; the eighth finishes after 491 seconds.
With batching_max_size=1, requests run one at a time in FIFO order. Four identical requests using the merge case in SGLang’s discussion still serialized under dynamic batching: ~60 seconds of compute each, with the fourth finishing at 245.6 seconds. From outside, I cannot distinguish failed merge conditions from an unconnected merge path. Dynamic batching did not improve throughput here.
Flat compute time as the queue grows points to scheduler admission rather than GPU contention. With one burst per concurrency level, this remains an observation, not a final conclusion.
This difference matters operationally. A health check can say the server is alive and the API can accept several jobs, while the useful service rate stays fixed. Capacity planning must therefore use completed clips per hour and queue wait, not accepted concurrency.
SP4 still serves one at a time, but each turn is shorter. Throughput is ~195 clips/hour; with 8 waiting, compute remains 17.3 seconds with σ = 0.01 seconds, and the last caller finishes after 130 seconds instead of 491. SP4 does not remove serialization; it makes each request 3.5× faster.
For context, SGLang reports 19.04 seconds on 8×B300 for the same task and canvas; my 4×GB300 run took 32.5 seconds. Simple 4-to-8-GPU arithmetic suggests 85% scaling efficiency, not a direct comparison across different machines, containers, software, and serving configurations.
For image→video, unchanged output settings fall from 67.5 to 23.8 seconds (2.8×), below text→video’s 3.5×. This is consistent with first-frame conditioning adding denoising and communication, although the experiment does not isolate them.
Below, the third clip adds a lossy step cut; the fourth spends the saved time on a 15-second output. These SP4 measurements are single-run examples, not stable averages.
67.5 s
23.8 s · same spec
11.6 s · + a lossy step cut
~109 s
FP8: density first
FP8 stores most DiT matrix weights in 8 bits while keeping sensitive projections and output layers at higher precision. Single runs reduced peak memory from 123 to 92 GB, freeing 31 GB, and ran about 8% faster.
Against BF16, FP8 measured LPIPS 0.13 for video and 8.2 dB log-spectral distance for audio. These are distance metrics, not quality scores; lower means closer. The clips remained close to my eyes and ears.
Both metrics use decoded H.264 and include compression differences. FP8 saves memory, but I did not show that the serialized scheduler can turn it into more concurrency. It also changes numerical precision, so production use needs a wider prompt set and a quality gate.
One visually close clip is evidence for this configuration, not a general model-quality result. The memory saving is clear; quality needs more prompts, motion patterns, faces, text, and audio cases before FP8 becomes a default.
Everything at once: one clip, three configurations
I combined Ulysses and FP8 on an 11.54-second reference→video clip: 277 frames at 1024×768, 50 steps, seed 7, joint audio, and one reference image. Each of 4 configurations has 3 runs with the same prompt and seed; the clips show one GPU, SP4, and SP4 + FP8. They are not bit-identical because reduction order and numerical precision change, but all 3 looked and sounded the same to me.
The shared prompt and reference image:
show prompt
subject_definitions: <Picture 1>: the provided reference image — a lone figure in a long dark coat and heavy black boots, photographed from a low angle from directly behind, walking on narrow grey stone above a vast gothic city of towers, arches and endless staircases, under a deep blue star-filled sky. The face is not visible in the reference and must never become visible.summary: reference generation — a new cinematic clip featuring the subject from <Picture 1>, seen only from behind, who runs, slows to a walk, stops to look back over his shoulder, and then breaks into a run again — and the moment he runs, the camera rolls off level until the whole world is leaning.retention_analysis: <Picture 1>: attribute_transfer — carry over the long dark coat, the heavy boots, the strictly rear low-angle framing, the grey stone architecture and the deep blue starlit sky; place the subject in the action below.detailed_description: [Shot 1] Cinematic live-action, night, cold blue starlight from above and pale grey bounce off the stone. The camera stays locked **behind** the subject for the entire shot — a low rear view of his back, his coat and his boots. His face is never seen, not once, at any point; the camera never overtakes him and never comes round in front. When he looks back we see only the back of his head and the line of his shoulder. Which way he is facing is read from his boots. A lone figure in a long dark coat — the subject from <Picture 1> — is on a narrow stone staircase between towers, high above a labyrinth of arches and bridges. From 00:00.00 to 00:02.00 he is already running hard up the steps, taking them two at a time, coat flaring, and the frame is perfectly level. From 00:02.00 to 00:02.50 he slows, his stride shortening. From 00:02.50 to 00:04.50 he walks, steady and unhurried, coat swinging at each step, the frame still perfectly level. At 00:04.50 he stops dead, both boots planted on the same step, and turns his upper body to look back down the stairs behind him — his boots pivot on the stone so we can read that he is now facing back the way he came, and we see the back of his head and his shoulder, never his face — and he holds there, completely still, for a beat. At 00:06.00 his boots pivot forward again and he breaks into a run up the steps, and **at that exact moment the camera begins to roll**: the horizon tips clockwise, the towers and staircases leaning. From 00:06.00 to the end he keeps running and the camera does not speed up — it only keeps rolling, the tilt deepening past 20 degrees, then 35, so the stone steps run diagonally across the frame and the star field slides sideways. By the end the frame is leaning past 45 degrees, the city hanging sideways, and he is still climbing away from us, still seen only from behind. No speech. His face is never visible.overall_soundscape: Fast doubled boot steps on stone for the first two seconds, then slowing to an even walking rhythm; breathing that starts hard and quick, settles as he walks, catches and holds during the moment he stops and looks back, then goes short and quick again as he runs; a scrape of grit as he stops, a pivot of leather on stone as he turns back and again as he turns forward; a faint high wind moving between the towers; one loose pebble kicked free and clattering down the steps at the moment he starts running again. No speech, no vocals.non_diegetic_music: Instrumental only, no vocals, no spoken word. Ethereal cosmic ambient with slow-building layers, beautiful and calm throughout — never frightening, never horror, no dissonance, no stingers, no sudden hits. Foundation: deep sub-bass drone with subtle movement. Layer 2: warm analog pad swells in Bb minor, long attack and release. Layer 3: glassy bell-like arpeggios with heavy reverb and tape delay, drifting in and out. Layer 4: shimmering high-frequency granular textures, like distant starlight. Layer 5: sparse plucked harp notes with wide stereo spread. Tempo 62 BPM, no drums until he starts running the second time, then a soft filtered heartbeat kick that locks to his running steps. Atmosphere: vast, weightless, floating in deep space, quietly awe-inspiring and a little melancholy. Analog warmth, wide stereo field, gentle sidechain breathing.
336.6 s · 694 kJ
90.4 s · 487 kJ
87.2 s · 466 kJ
| configuration | inference_time_s | peak per GPU (mean, range) | energy per clip | 4-GPU domain power | estimated 4-GPU occupancy cost proxy (USD) |
|---|---|---|---|---|---|
| 1 GPU, BF16 | 336.59 s ± 0.03 | 133,287 MB (±0.1 %) | 694.0 kJ | 2,041 W | $3.22 |
| + Ulysses SP2 | 177.14 s ± 0.11 | 117,270 MB (114,846–122,020) | 559.2 kJ | 3,106 W | $1.70 |
| + Ulysses SP4 | 90.39 s ± 0.07 | 97,701 MB (95,840–101,330) | 486.9 kJ | 5,174 W | $0.87 |
| + FP8 | 87.17 s ± 0.06 | 65,065 MB (64,742–65,576) | 465.6 kJ | 5,168 W | $0.83 |
Energy covers submit-to-done, including HTTP and polling. SP2/SP4 memory varies by 5–7 GB across 3 runs and is indicative; latency and energy are measured. The cost proxy is inference_time_s × 4 GPUs × $8.62/GPU-hour ÷ 3,600, not an invoice or quote.
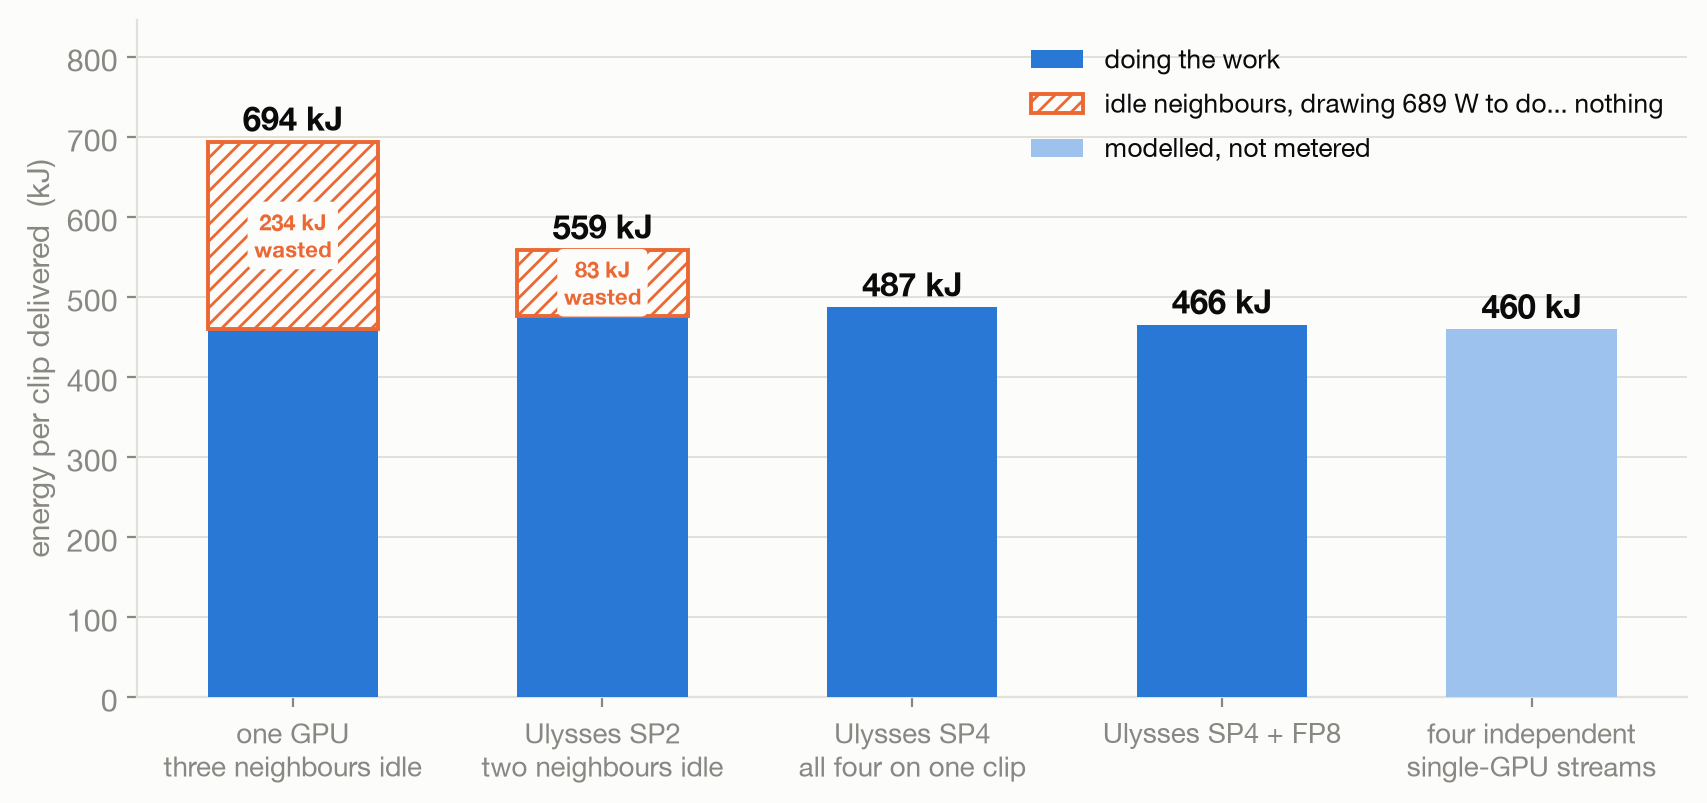
At the same output specification: 3.86× faster, 33% less energy, and 51% lower peak memory per GPU. Ulysses supplies 3.72×; FP8 adds 3.6% less time but 33% less memory. Its main value is fleet density.
Ulysses gets more efficient as it widens
I measured the same clip and seed at each Ulysses width, n = 3.
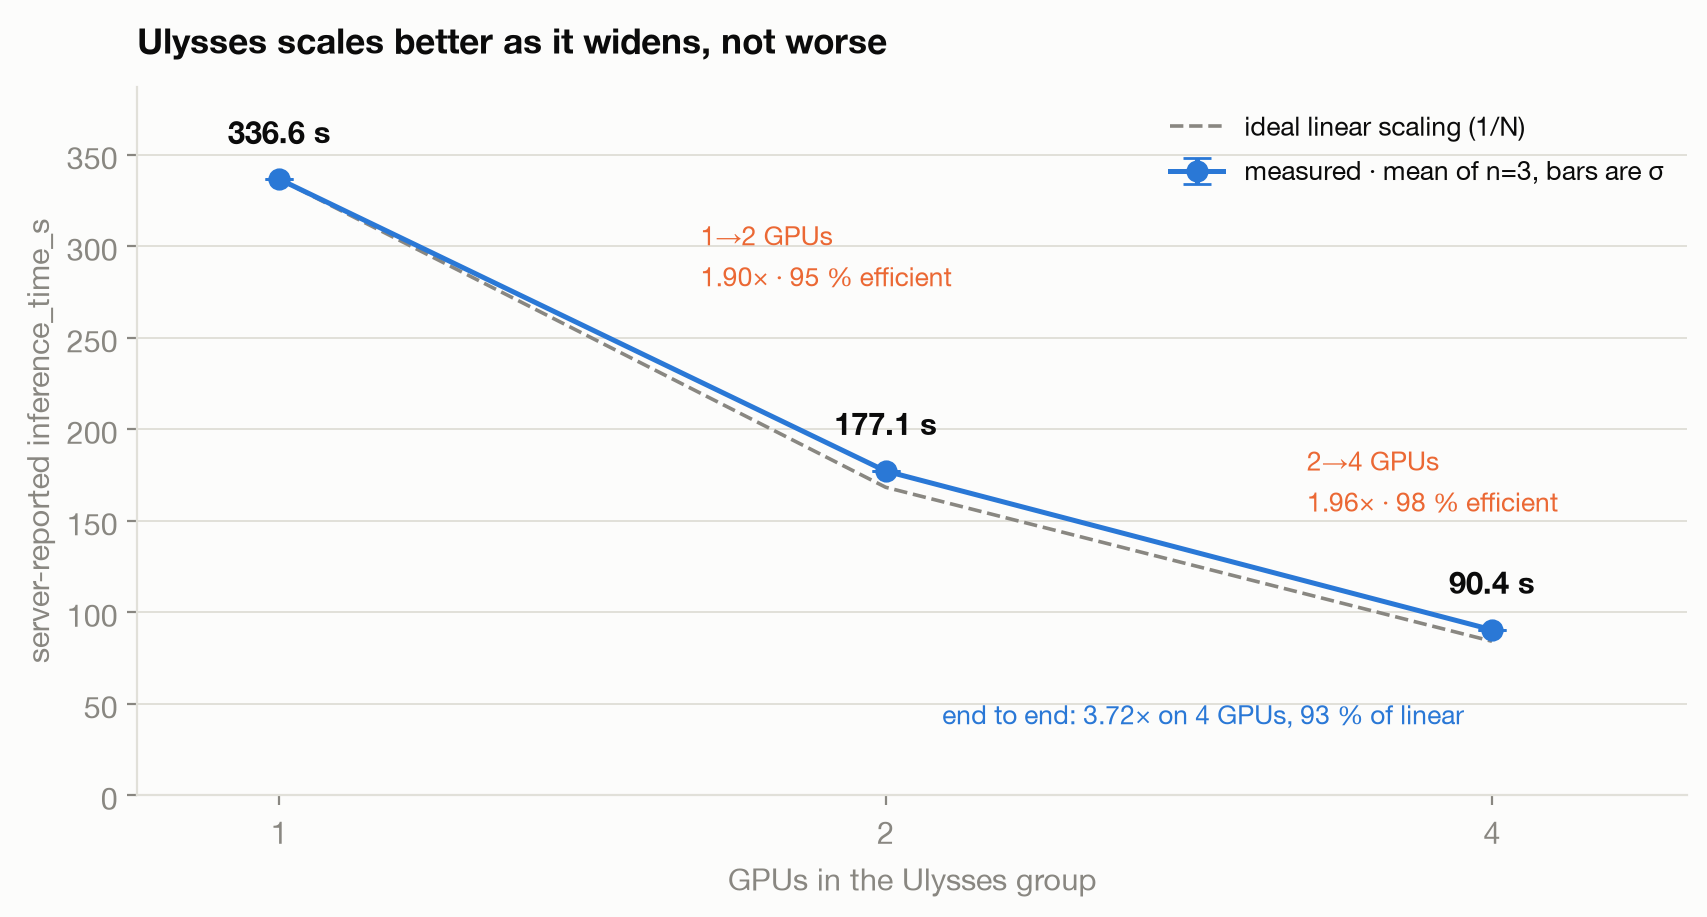
| GPUs | inference_time_s | speedup over the previous rung | efficiency of that doubling |
|---|---|---|---|
| 1 | 336.59 s ± 0.03 | – | – |
| 2 | 177.14 s ± 0.11 | 1.90× | 95 % |
| 4 | 90.39 s ± 0.07 | 1.96× | 98 % |
SP4 reaches 3.72×, or 93% of ideal linear scaling. I did not trace NCCL, so I cannot explain the slightly higher 2→4 efficiency. Wider runs need another tray.
Over 90.39 seconds, 4 GPUs accumulated 16.15 TB of endpoint Tx+Rx counters: 178.6 GB/s aggregate, 44.7 GB/s per GPU. Sender and receiver each count a byte, so unique link traffic is ~8.07 TB. The balanced counters do not identify the collective.
The lossy ceiling: fewer denoise steps
Ulysses trades GPUs for latency; cutting denoise steps trades quality. Five runs per point fit a 2-parameter line:
inference_time_s = 3.145 s + 1.1645 s × (steps − 1)Means are 11.31 seconds at 8 steps, 25.25 at 20, 36.93 at 30, and 60.21 at 50 (σ ≤ 0.09 seconds); maximum residual is 22 ms. The −1 matters because num_inference_steps includes terminal zero: 50 requested steps run 49 evaluations.
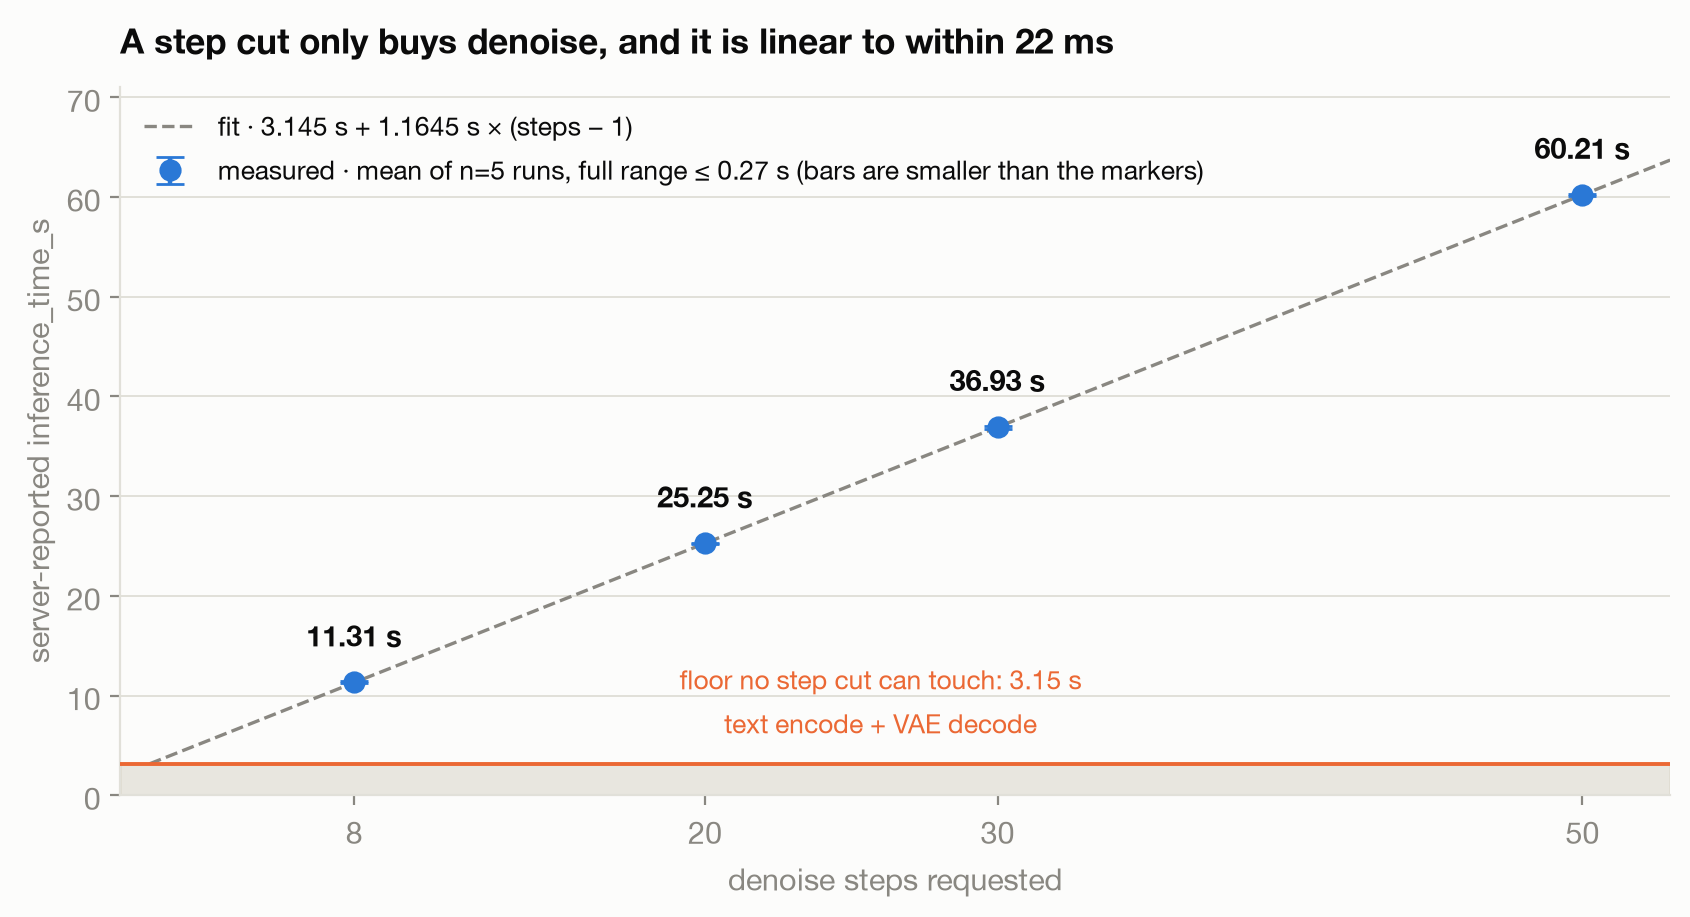
The fit independently matches the host log: (55.69 + 1.23) / 49 = 1.162 seconds/evaluation, within 0.3% of 1.1645. Its 3.15-second intercept matches decode plus text encode; mostly GPU VAE decode, already 28% of an 8-step request.
To me, the 30-step clip is difficult to distinguish from 50 steps, but distance grows as steps fall. Video LPIPS is 0.35 at 30, 0.47 at 20, and 0.60 at 8; audio log-spectral distance is 9.4, 16.0, and 19.9 dB. Lower is closer to the 50-step output.
Speedups are also against 50 steps. Timing uses a different prompt but the same resolution, duration, and output settings, keeping performance and visual comparisons independently reproducible.
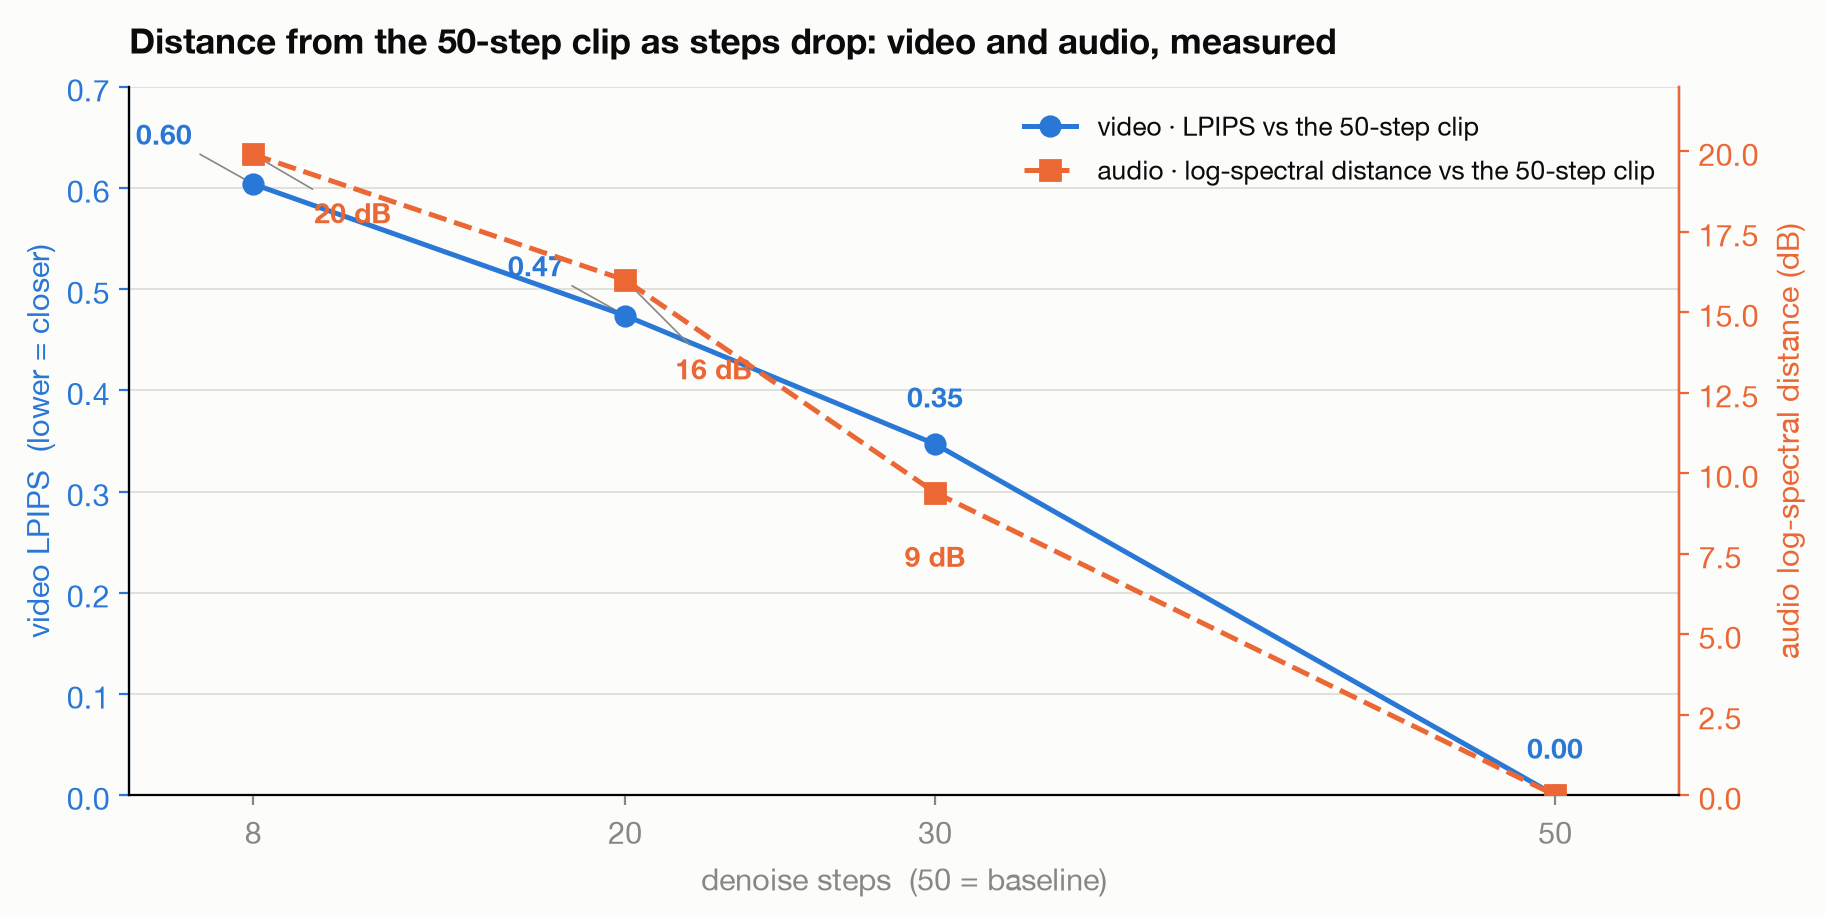
This simple step cut is not a production recommendation; distilled Turbo LoRAs target better few-step quality. The ladder isolates latency that scales with denoising from fixed preparation, VAE decode, and CPU encoding.
Power cap: 28% slower for 6% less energy
The GPU could not hold a requested 2,070 MHz under its 1,400 W limit; denoise settled at 1,545–1,642 MHz. At 1,000 W, the clip took 77 instead of 60 seconds (28% slower) while serving-GPU energy fell only from ~80 to 76 kJ (6%). This trade fits a hard power budget, not efficiency. Reproducible comparisons must fix power and record the delivered clock.
9. Reading the Grace–GPU fabric from the host
NVLink-C2C carries coherent data between Grace and the GPUs; the CPU-side Scalable Coherency Fabric (SCF) connects Grace memory. Their PMUs reveal when and how many bytes cross each path. I read them from the host with perf_event_open, which requires root or CAP_PERFMON but does not instrument or single-step the target.
This is the third observability layer in the post. Launch uprobes show when the host asks for GPU work, SGLang timers name model stages, and PMUs show the data path beneath both. Aligning their timestamps turns fabric bytes into request phases rather than an unexplained aggregate counter.
Linux AutoNUMA moves pages between CPU NUMA nodes to improve locality. On coherent Grace–GPU memory, the GPU caches address translations for those pages. Migration may therefore require an SMMU Address Translation Cache (ATC) invalidation even when application code does not explicitly move GPU data.
Disabling AutoNUMA reduced SMMU ATC invalidations from 451 to 12 and page migrations from 51 to 0 in one steady-state single-GPU capture, without measurable latency change. A separate 4-clip SP4 capture showed about 90× fewer invalidations.
This is consistent with migration creating ATS translation maintenance, but generic probes cannot pair each migration with an invalidation. AutoNUMA-off reduces unnecessary fabric activity on this idle tray; it is not a latency optimization.
numa_balancing=1 → 51 page migrations, 451 SMMU callsnuma_balancing=0 → 0 page migrations, 12 SMMU calls, same ~60 s wall-clockMy first attempt missed that each of the 2 Grace sockets has its own uncore PMU instance. One counter sees only half the tray, so both must be combined. An idle server then reports:
c2c1_s0/loc c2c1_s0/rem c2c1_s1/loc c2c1_s1/rem 0 865,792 865,280 0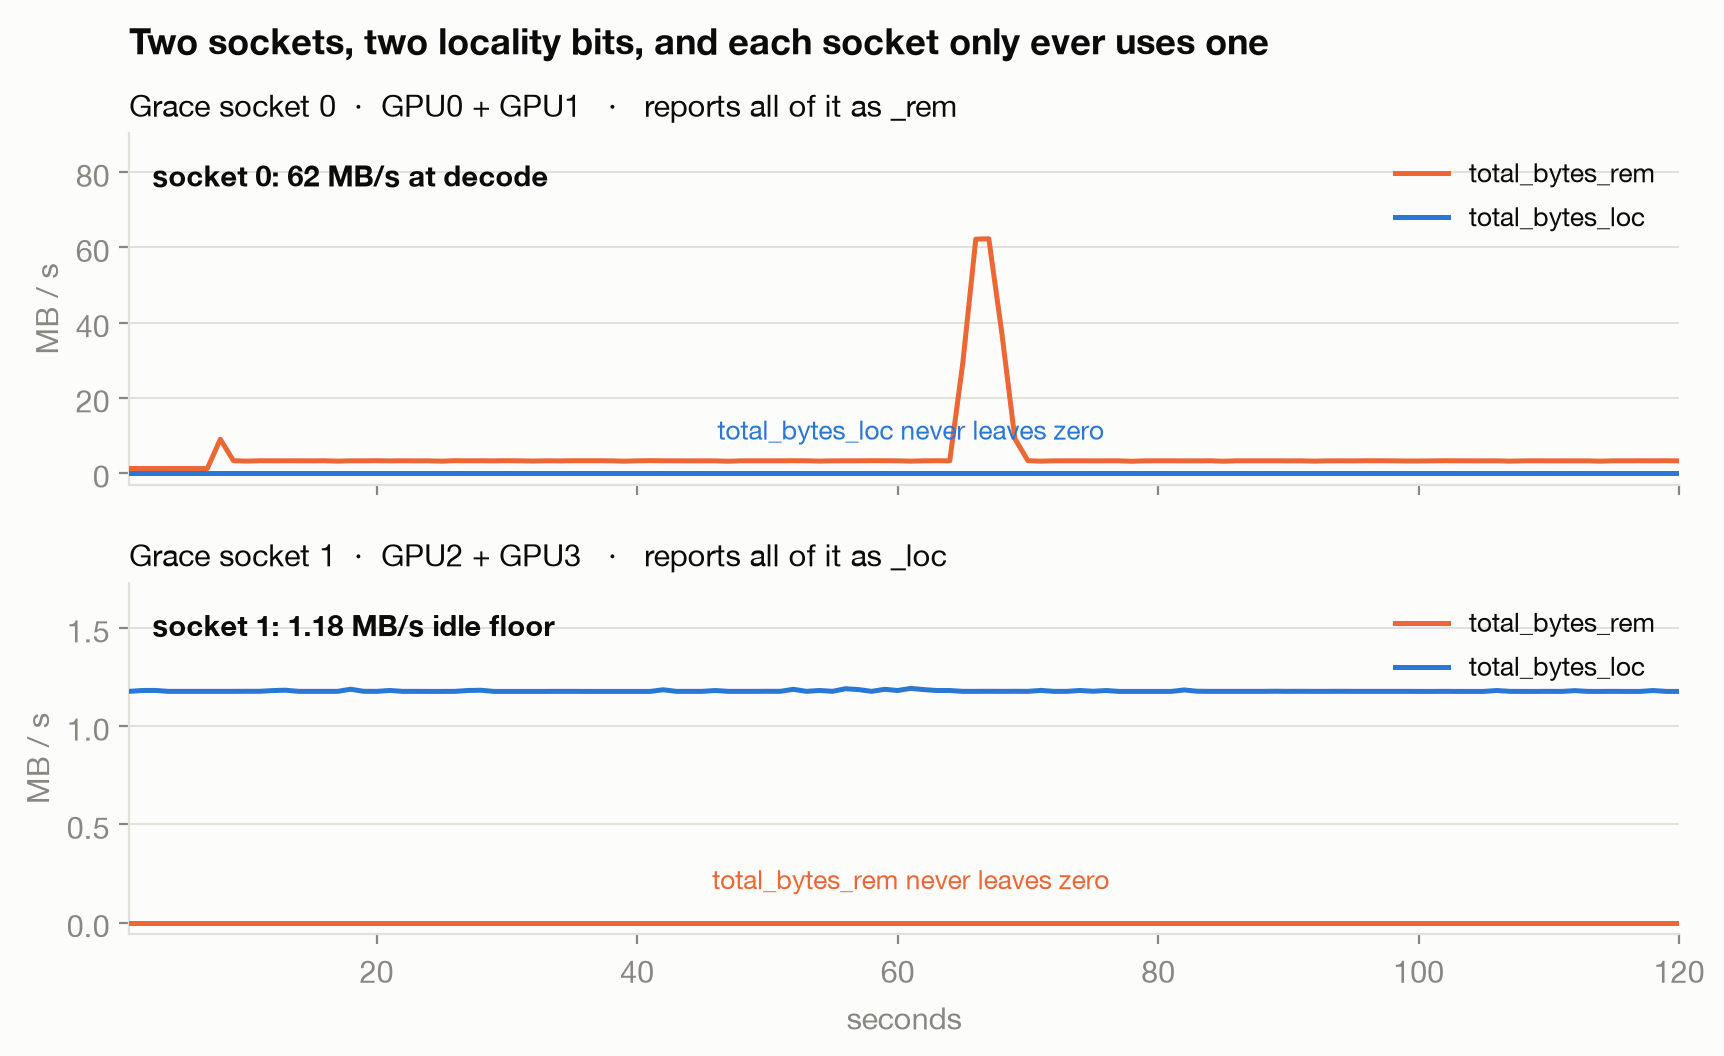
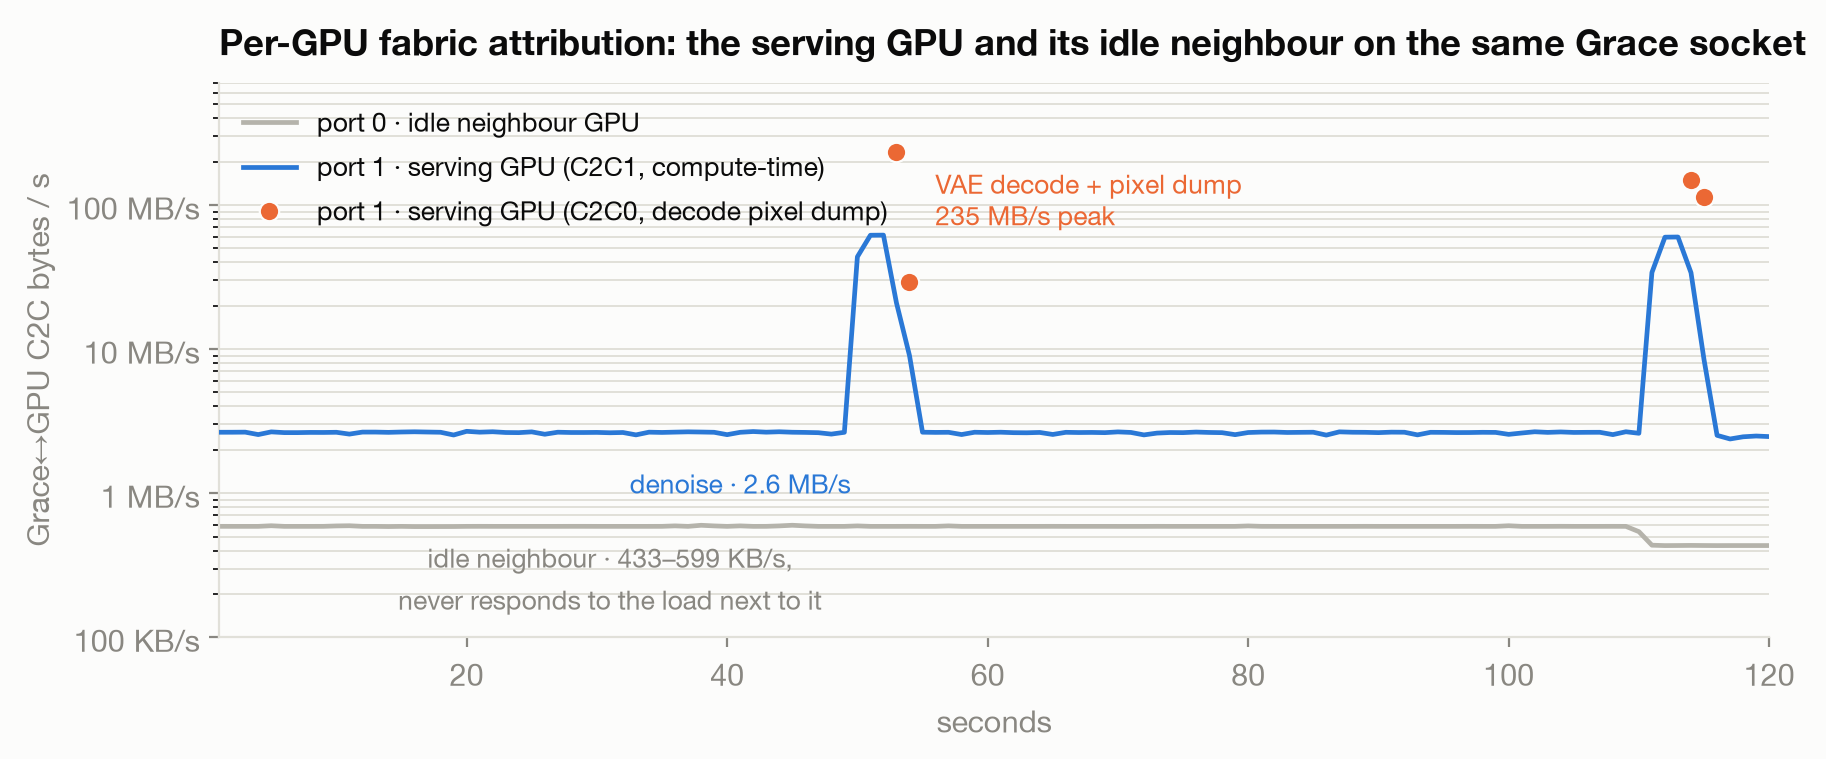
The PMU labels ~865 KB/s remote on socket 0 and local on socket 1. This is not misplaced memory: numastat showed GPU0 holding 64 GB on local node 0 despite the remote label, while GPU2 produced the opposite label.
Here, local and remote appear fixed to counter paths rather than process-memory locality. The kernel PMU documentation covers sockets and port filtering, not this mapping. Total bytes agree within 0.5%, so I trust volume but never infer NUMA placement from these labels.
Mapping one port to one GPU
The port filter is more useful. Loading one GPU at a time maps logical ports to physical GPUs; idle ports match, then separate under work:
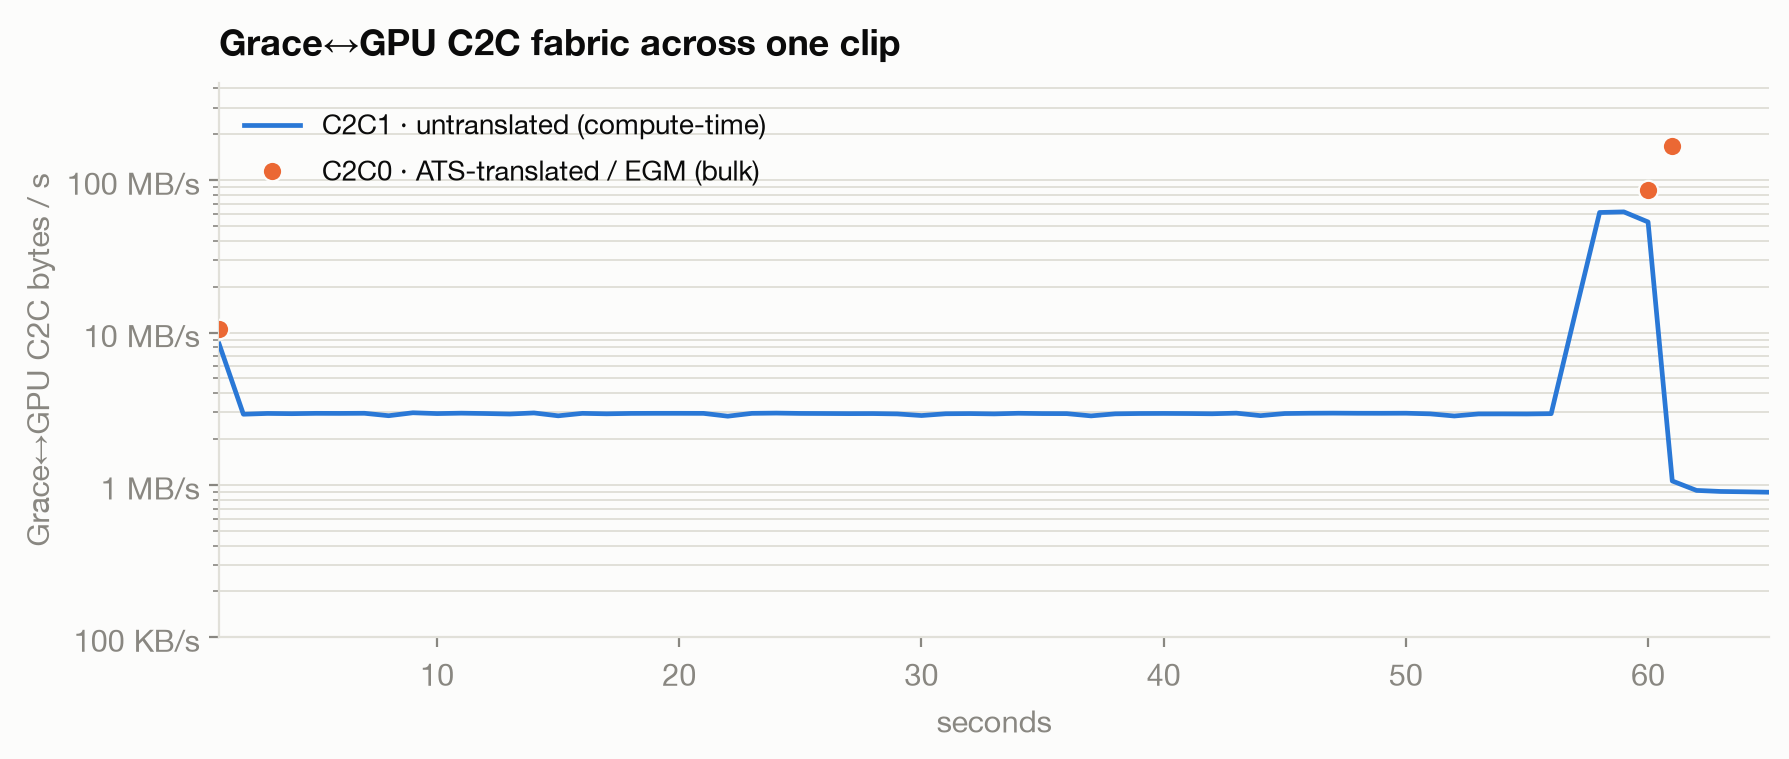
port 0 port 1 idle 432,896 432,896 denoise 588,288 2,646,528 VAE decode 588,288 61,787,648 pixel dump (C2C0) 0 234,709,504Port 1 serves while port 0 idles. Two independent renders each produced 264,110,080 B on C2C0. A whole-socket capture split this into a 253,583,872 B decode burst and 10,526,208 B at request start. The host cannot determine which partition is physically correct, so I name the capture when it matters.
What the bytes mean
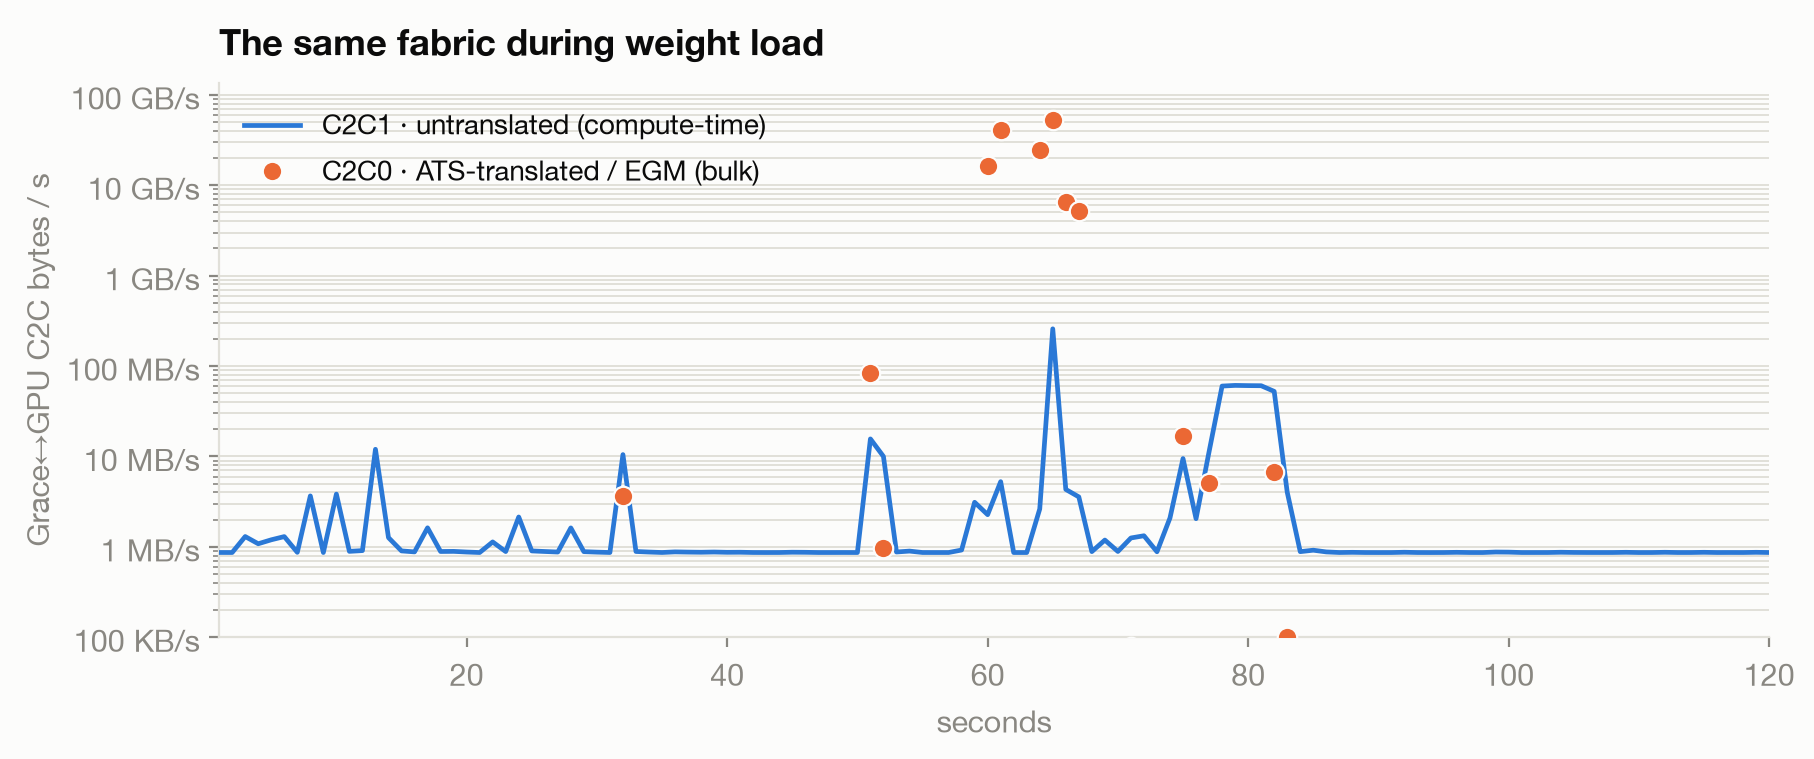
SCF is less ambiguous. A 5-second weight-load window recorded 129.6 GB of cross-socket reads, peaking at 58.2 GB/s. Weights landed on node 0 while 152 server threads ran on socket 1, consistent with Run:ai Streamer crossing the fabric during its 7.0 GiB/s host-staged read. An SCF beat carries up to 32 bytes; it is not a coherence-notification count.
GPU2 produced 60.08 seconds (n = 3, σ 0.14) versus 60.32, with matching memory and fabric volume. Placement did not change latency, but without SP8 or multi-tenant tests I would still bind CPU and memory per rank; numactl --cpunodebind --membind also removes observed thread-placement variance.
Fabric rate identifies phase across 4 orders of magnitude: ~52 GB/s in weight load, ~2.9 MB/s in denoise, and ~60 MB/s as pixels cross to Grace for libx264. Quiet denoise is consistent with a working set in HBM, which the host PMU cannot observe directly.
The 253.6 MB decode burst is within 0.5% of 107 × 1024 × 768 × 3 = 252.4 MB raw RGB. Timing and bytes identify the pixel dump; AutoNUMA calls align with C2C0 only as correlation.
DCGM provides coarse per-GPU C2C totals. Grace PMUs add class, phase, and GPU resolution through a small Python reader.
Four follow-ups remain: tiled VAE decode, persistent JIT caching, storage paths, and true replica throughput. First-ever warmup took 69 seconds and a later warm-cache observation ~16; these are warmup-only, not the 104-second process-to-ready measurement, and other state also changed. I cannot attribute the full reduction to JIT caching.
Work around denoise is ~8% of inference; host-owned ingest and final encoding are ~2%. These mostly fixed costs grow in relative importance as denoise improves.
What I would do on a dense tray
-
Use idle GPUs for another stream or combine them for latency; three idle GPUs consumed 689 W.
-
Size capacity by service rate, not accepted callers: the eighth waited 491 seconds without raising throughput.
-
Fix power and record the delivered clock; the configured clock alone was not reproducible.
-
Use FP8 mainly for density: 3.6% less latency, 33% less memory here.
-
Include JIT warmup in cold-start budgets; it was roughly half of 104 seconds.
-
Use eBPF for continuous host visibility and Nsight for kernel detail. Here: 1.1% / 8 KB versus 7.1% / 21 MB.
10. What this still does not show
This post measures the host boundary: GPU launch requests, syscalls, CPU scheduling, I/O, and Grace–GPU fabric counters. Warp occupancy, tensor-core utilization, register pressure, and memory coalescing remain CUPTI and Nsight Compute territory.
Device-side eBPF is complementary. My bpftime PTX 8.8 and CUDA 13 support merged in PR #647; issue #646 tracks H3 launch paths not yet fully intercepted. This post uses the validated combination: host eBPF + hardware counters.
Model-side paths also hit platform limits. Sol Engine reports 3.95× over Diffusers, but my Sol-Attn build lacked a fast sm_103 kernel. Cache-DiT rejected the configuration, device-side eBPF remains blocked above, and no calibrated public H3 NVFP4 checkpoint was available.
Today denoise dominates. As it improves, fixed ingest, synchronization, decode, and output encoding will take a larger share.
Related work covers host launch tracing in eInfer and ProfInfer, Grace–GPU C2C bandwidth, and rack-scale generation in VisualGen.
As of August 2026, I could not find published H3-on-GB300 measurements for 3 narrower questions:
-
How input type changes host and GPU work under matched output settings: launch counts remain close at 37k, 38k, and 34k, while denoising grows from 56 to 62 to 95 seconds.
-
How Grace↔GPU fabric traffic changes during each request phase when measured continuously from the host.
-
How to attribute that traffic to individual GPUs on a two-GPUs-per-socket tray using the PMU port filter.
I expected a hidden host bottleneck. Instead, the boundary is clear: denoise is compute-bound today, while the host contributes a smaller, measurable fixed floor. That result separates useful serving knobs from noise and shows which costs matter next.
The negative result is part of the contribution. Host tuning did not rescue a GPU-bound baseline, but host observability identified the synchronization floor, explained cold start, exposed scheduler serialization, and attributed coherent traffic to a request phase and physical GPU. Those are the signals I would keep in a real serving system while model-side optimization continues.
References.
- SGLang: SGLang Diffusion and the MiniMax-H3 cookbook, including the 8×B300 numbers. SGLang repository · SGLang Diffusion post
- NVIDIA: Run:ai Model Streamer (weight streaming to the GPU). https://github.com/run-ai/runai-model-streamer
- NVIDIA: Grace Performance Tuning Guide (NUMA / OS settings; uncore PMU event tables and bandwidth formulas). https://docs.nvidia.com/dccpu/grace-perf-tuning-guide/os-settings.html · https://docs.nvidia.com/dccpu/grace-perf-tuning-guide/measuring-performance.html
- bpftime / eGPU: device-side eBPF for GPUs. https://github.com/eunomia-bpf/bpftime
- MiniMax: MiniMax-H3, released under the MiniMax H3 Community License. I do not redistribute or link the weights; see the official license for its territory and redistribution terms.
- NVIDIA: Video Encode and Decode GPU Support Matrix (datacenter Blackwell: NVDEC + nvJPEG, no NVENC). https://developer.nvidia.com/video-encode-and-decode-gpu-support-matrix-new
- Code: EzgiTastan/minimax-h3-gb300-ebpf. Benchmark harness, host-side eBPF probes, Grace–GPU PMU readers, retained measurements, validation tests, and figure-generation scripts.
- NVIDIA: Sol Engine for MiniMax-H3 (kernel fusion + cross-step cache + Sol-Attn; 3.95× vs Diffusers, no distillation; 8×GB200 cookbook canvas 6.88 s vs SGLang 19.30 s). https://nvlabs.github.io/Sana/Sol-Engine/H3/
- F. Werner, M. Weisgut, T. Rabl: “Towards Memory Disaggregation via NVLink C2C: Benchmarking CPU-Requested GPU Memory Access”, HCDS ‘25 (up to 168 GB/s on GH200).
- SGLang: discussion #34079 on H3 dynamic batching: the merge check rejects any request carrying an image condition, so conditioned requests serialize while identical-parameter text→video requests merge. https://github.com/sgl-project/sglang/discussions/34079
- Linux kernel: NVIDIA Tegra241 (Grace) uncore PMU documentation: the C2C port bitmap and per-socket PMU instances. (The LOC/REM event names and the SCF 32-byte data-beat definition are documented in NVIDIA’s Grace tuning guide, not this page.) https://docs.kernel.org/admin-guide/perf/nvidia-tegra241-pmu.html
- eInfer: host-side eBPF attribution for GPU inference (eBPF ‘25). https://doi.org/10.1145/3748355.3748372
- ProfInfer: host-side launch attribution for LLM inference (MLSys ‘26); abstract reports <5 % overhead, ≤3.7 % measured. https://proceedings.mlsys.org/paper_files/paper/2026/file/03dbc11a22e79cd38bea53cf518c2371-Paper-Conference.pdf
- NVIDIA: DCGM field identifiers: the default DEV C2C fields are link state/capability only (LINK_QUANTITY 285, LINK_STATUS 286, MAX_BANDWIDTH 287); the profiling PROF group adds coarse per-GPU C2C byte totals (C2C_TX/RX_ALL/DATA_BYTES 1076–1079) with no ATS class, port, or local/remote split. https://docs.nvidia.com/datacenter/dcgm/latest/reference/field-identifiers.html
- NVIDIA: “Scaling Video Generation Across NVL72 Rack with TensorRT-LLM” (the VisualGen runtime: CFG, Ulysses, Attention2D and parallel VAE on one DeviceMesh; Wan 2.2 T2V-A14B denoise ~53×, end-to-end ~41×, 1× B200 → GB200 NVL72; the Amdahl-tail argument). https://github.com/NVIDIA/TensorRT-LLM/blob/main/docs/source/blogs/tech_blog/blog25_Scaling_Video_Generation_Across_NVL72_Rack_with_TensorRT-LLM.md
Model credit & license. Powered by MiniMax H3. Every video clip in this post is AI-generated with MiniMax H3. MiniMax H3 is licensed under the MiniMax H3 Community License Agreement, Copyright © 2026 MiniMax. All Rights Reserved.