Profiling Voice AI on H100 with eBPF
I traced STT and TTS containers on an H100 with bpftime. The GPU was at 0% while the CPU was doing 169K malloc/s. Here's everything I found.
Yes, everyone monitors their GPU's utilization, but what if the bottleneck is not your GPU?
In this blog post, I used bpftime to trace memory allocations inside an STT (speech-to-text) container running on an NVIDIA H100, and found out how 5 concurrent requests can be faster per-request than 2 concurrent ones. The STT model (Qwen3-ASR-1.7B) is served through vLLM's multimodal inference support.
some notes:
I used LD_PRELOAD to inject bpftime's agent into the container at startup since I didn't want to rebuild the image for profiling, along with the malloc uprobe example from the bpftime repository.
By the way, malloc is a function that allocates host memory (RAM), not GPU memory, therefore, as you can guess, tracing malloc only reveals CPU-side work.
If you want to trace CUDA API calls (cudaMalloc, cudaLaunchKernel, cudaMemcpy, these are all CPU-side calls in libcudart.so that manage device memory and kernel launches),
and bpftime can do that with regular uprobes too (GPU examples).
I later explored that path on a Grace–Blackwell system by profiling MiniMax-H3 on GB300 with SGLang and host-side eBPF, including CUDA launch timing and Grace–GPU fabric counters. To learn more about eBPF, you can check this video.
Small finding (kinda small.. took me half an hour before starting the experiment):
When I first tried bpftime with Docker, I didn't get any errors or warnings. However, bpftime load needs to know where the malloc function lives inside the target process.
It figures this out by looking at the C standard library (libc) on whatever machine it's running on. And it turns out I ran it on the host (which uses Ubuntu 22.04). But the container runs Ubuntu 24.04 with a different version of libc.
Different libc version means malloc will sit at a different memory address:
# Host (Ubuntu 22.04)$ readelf -s /lib/x86_64-linux-gnu/libc.so.6 | grep " malloc@"   379: 00000000000a50a0   828 FUNC    GLOBAL DEFAULT  15 malloc@@GLIBC_2.2.5
# Container (Ubuntu 24.04)$ docker exec stt readelf -s /lib/x86_64-linux-gnu/libc.so.6 | grep " malloc@"  1806: 00000000000ad650   796 FUNC    GLOBAL DEFAULT  17 malloc@@GLIBC_2.2.5
bpftime placed its probe at the host address, which inside the container points to some random piece of code, not malloc. So the probe fired on nothing useful and silently produced zero results.
Fix: run bpftime load inside a container built from the same base image as your target.
Both containers need --ipc=host so that they can communicate through shared memory (/dev/shm).
Model Loading
Before we send any requests, let's watch the model load. During that time, as you can see from the screenshot, bpftime shows ~100K-220K malloc/s.
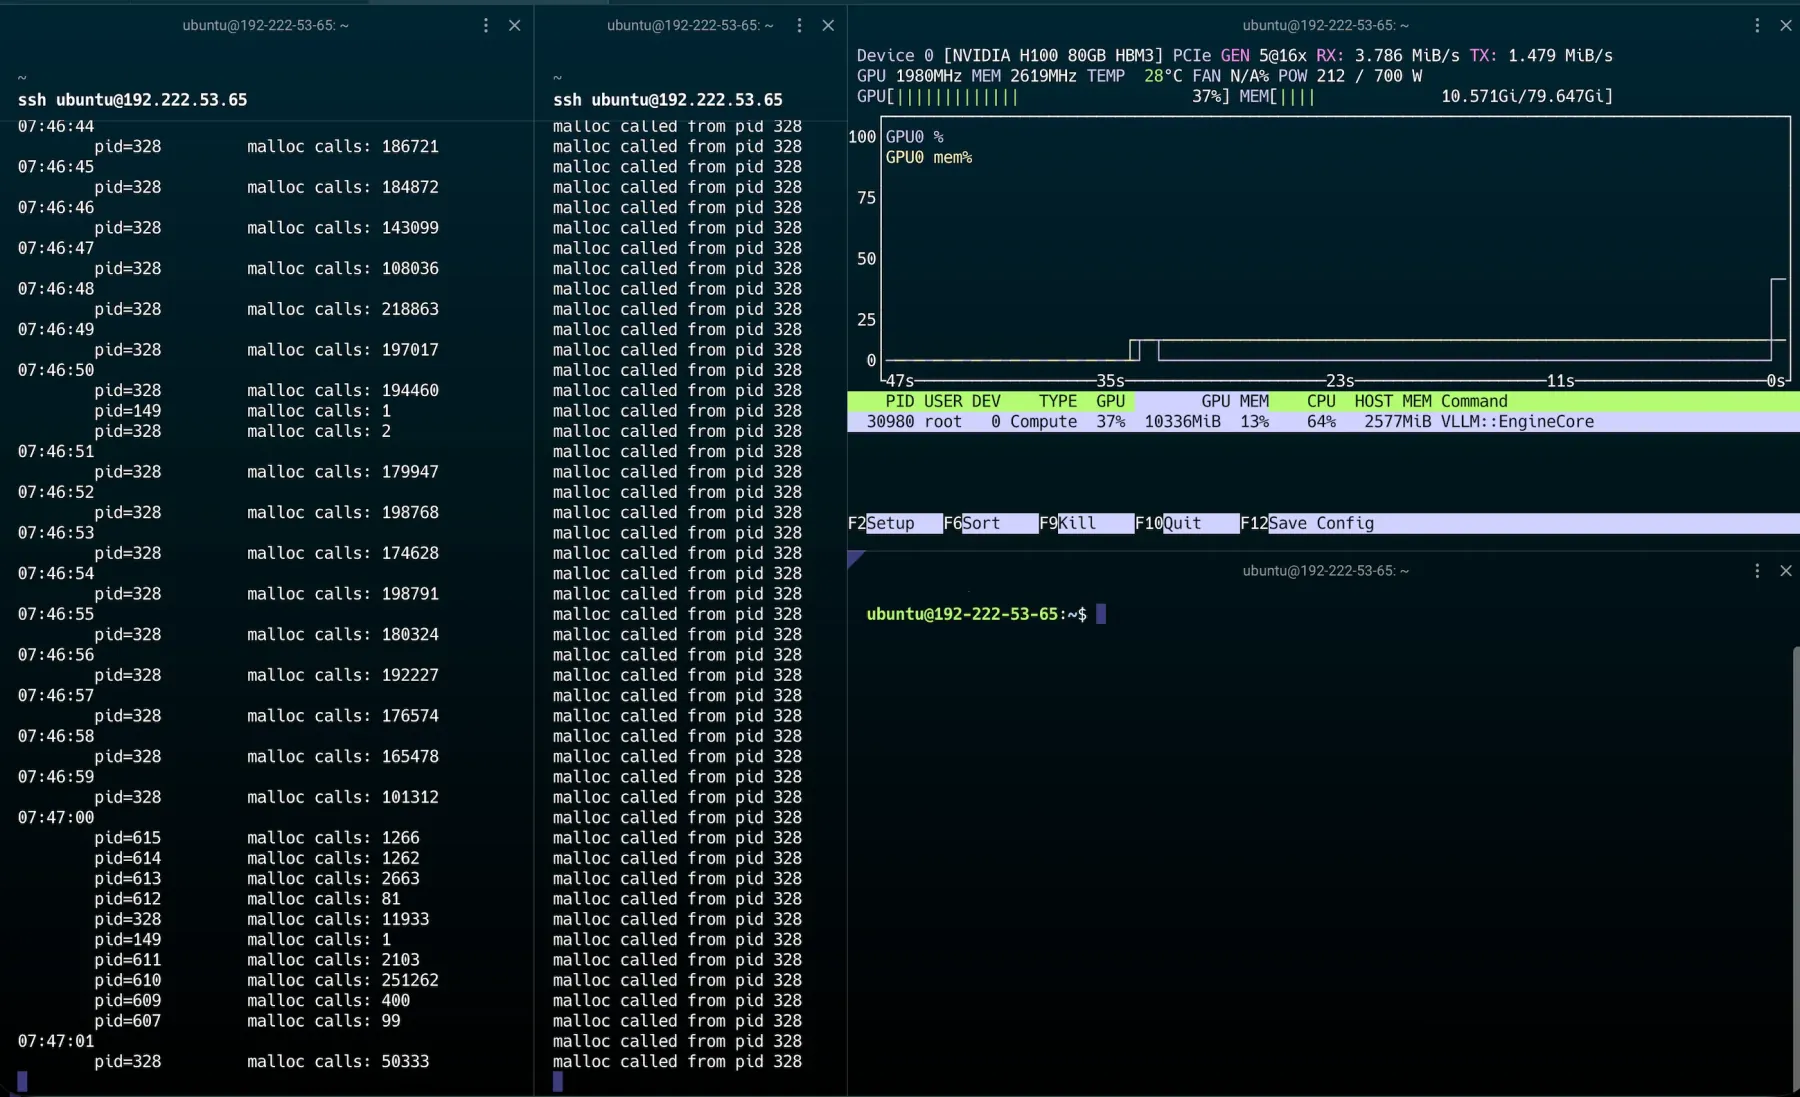
Let's read the screenshot together:
Top left: bpftime malloc counts per second (pid=328 is fastAPI, pid=149 is vLLM). In middle terminal, each line = one malloc call being traced by bpftime (you can feel how fast this terminal was going... I am happy that this part wasn't blurry during the screenshot.).
Test 1: First Inference (= Cold Cache)
I sent a single 5-second Turkish audio file.
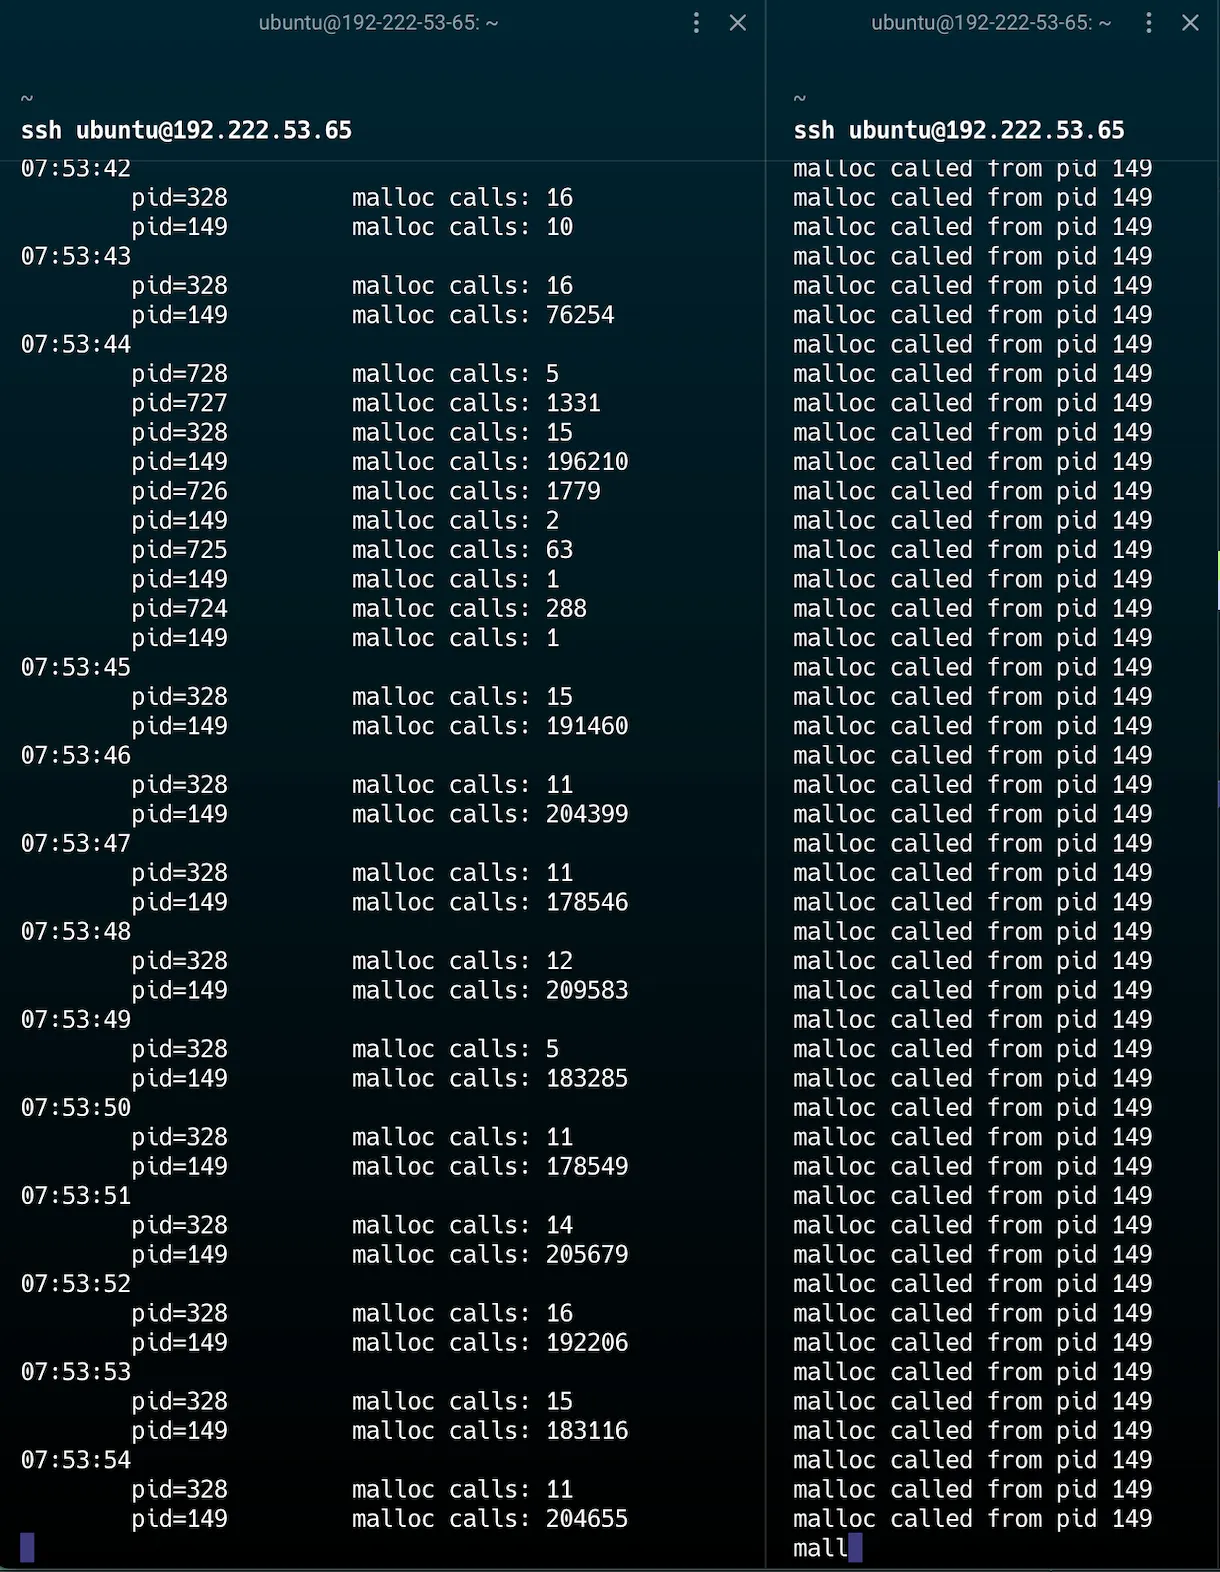
Check bpftime, memory allocation count is huge! This first inference involves CUDA graph warmup and capture.
Test 2: Run Same Audio Again (Warm Cache)
The second run is 4x faster. It replays the already cached CUDA graph, and as you can see bpftime confirms this: the malloc burst is significantly shorter this time.
Test 3: Same Speech, but Noisier
Sending a noisy version of the same audio produces identical latency, because the CUDA graph cache is already warm and model weights are loaded. The only difference is confidence:
| Audio | Word | Confidence | |-------|------|-----------| | Clean | "Merhaba" | 0.952 | | Noisy | "Merhaba" | 0.656 |
Test 4: Same Audio Twice (No Caching)
I was curious: does vLLM cache the result if you send the exact same audio? I sent the same file twice with 2-second gap.
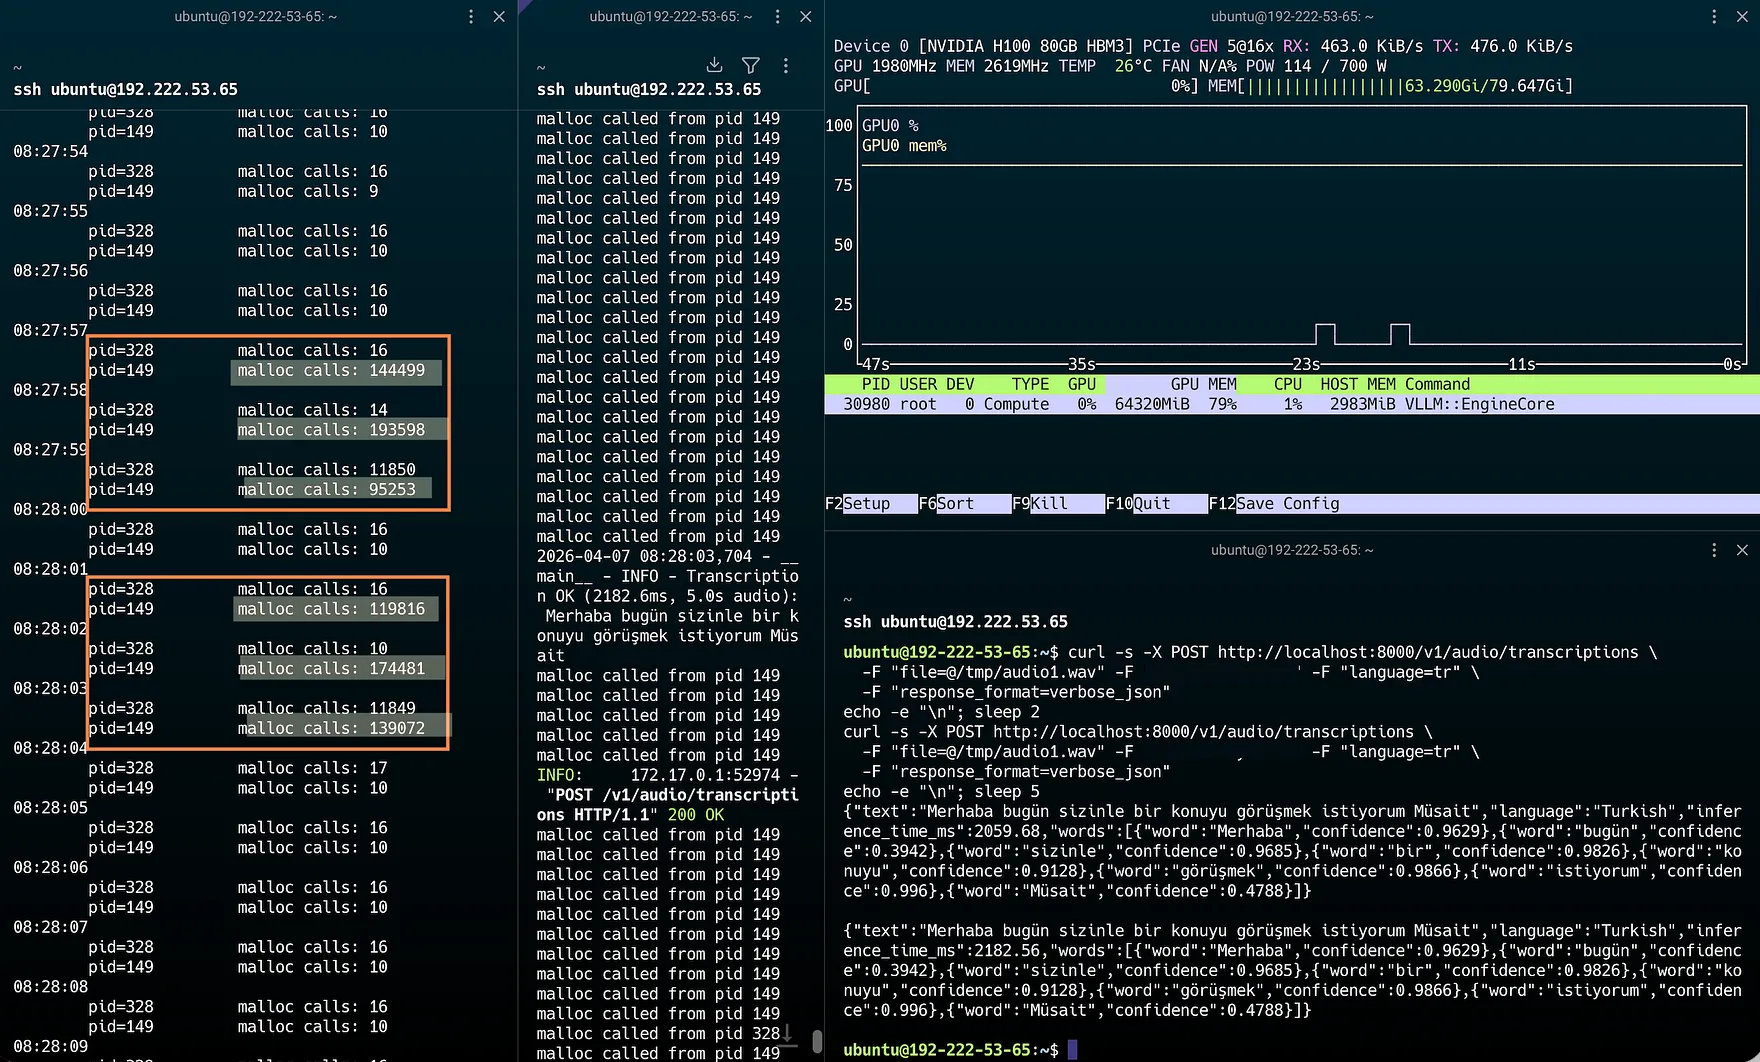
Both requests show nearly identical malloc patterns as shown in the screenshot.
First spike:pid=149 malloc calls: 144,499 → 193,598 → 95,253 → then baseline
Second spike:pid=149 malloc calls: 119,816 → 174,481 → 139,072 → then baseline
So, each request is processed from scratch. The speed is consistent because CUDA graphs are already warm, not because the model "remembers" the previous audio :D
We learnt that repeating the same audio does not reduce memory allocations. Every request goes through the same full pipeline (audio preprocessing, feature extraction, attention computation, etc.)
Test 5: 3 sequential requests
Well... Let's simulate a more realistic scenario. I sent 3 different audio files back-to-back in a for loop (pov of production pod would see during normal traffic):
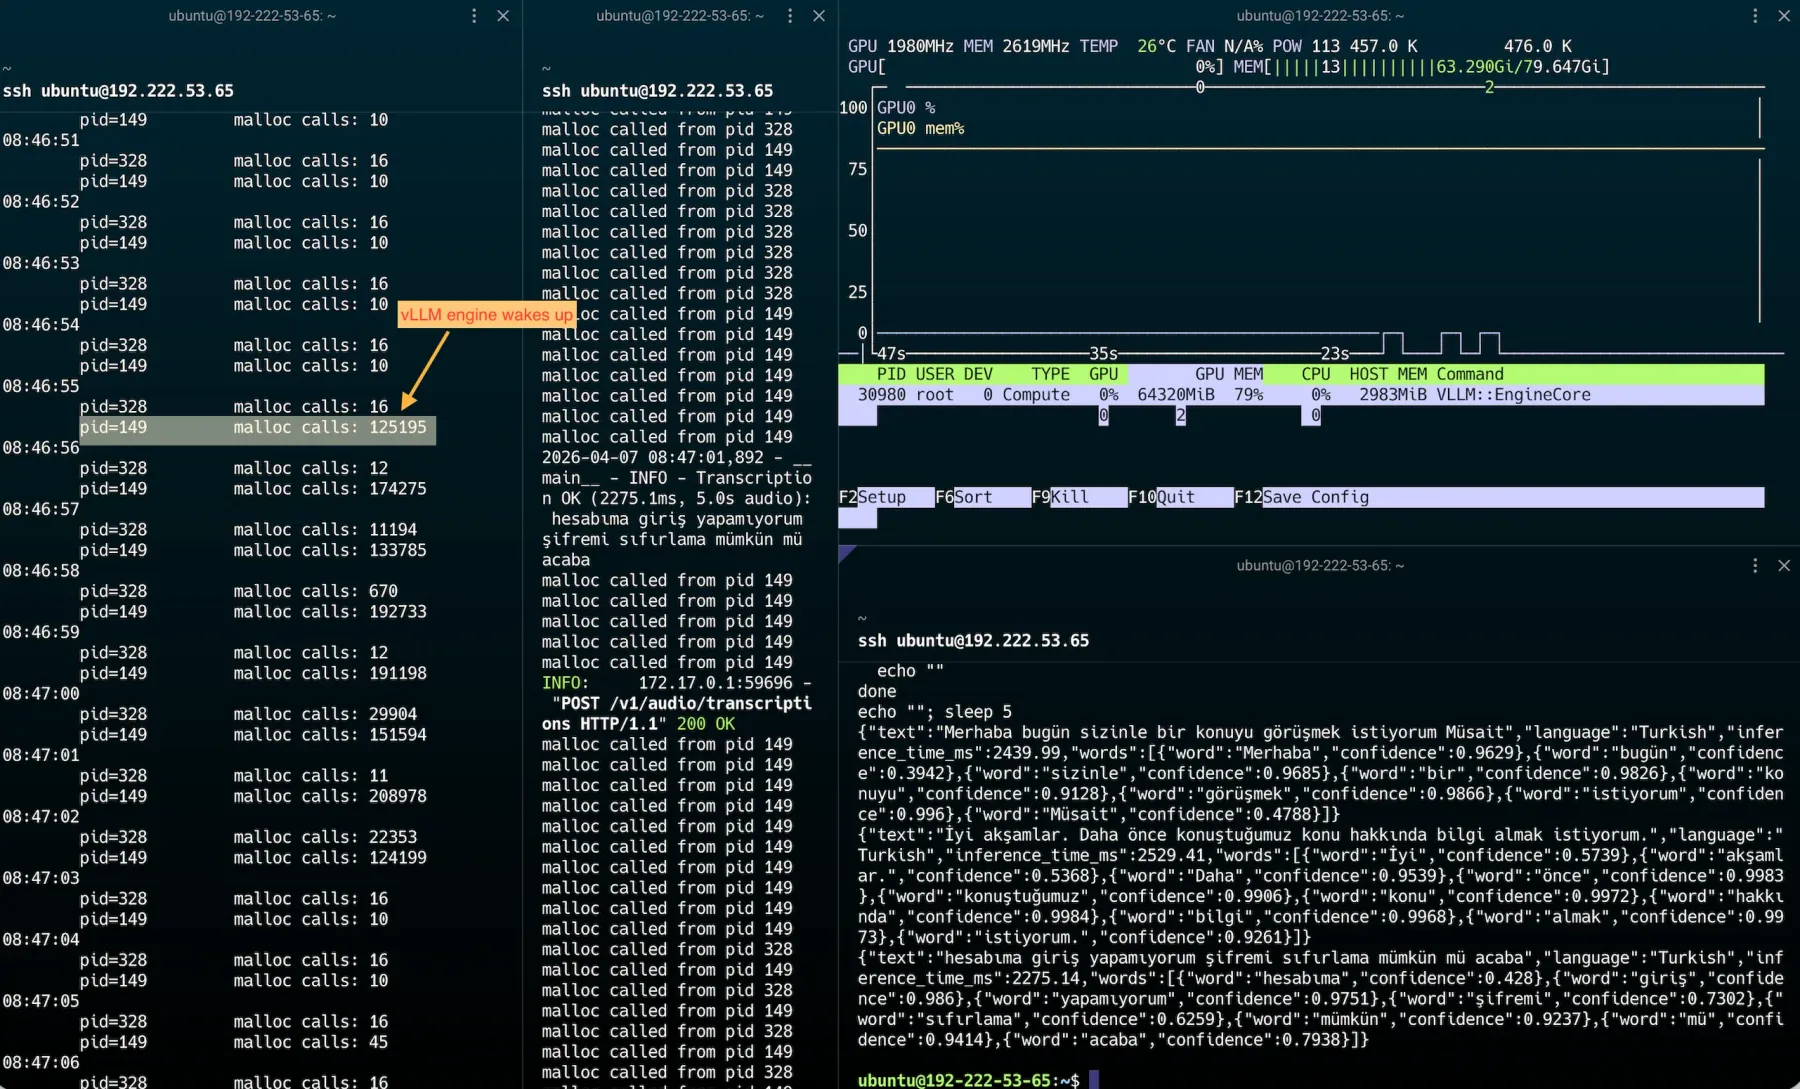
pid=328 (FastAPI) process received the first audio, decoded the wav file and passed it to the vLLM engine (pid=149).
The engine allocated 125K memory blocks to start processing.
With bpftime we saw which process (fastAPI vs vLLM engine) was busy at each second + how many memory allocations each process made.
Test 6: 2 Concurrent Requests
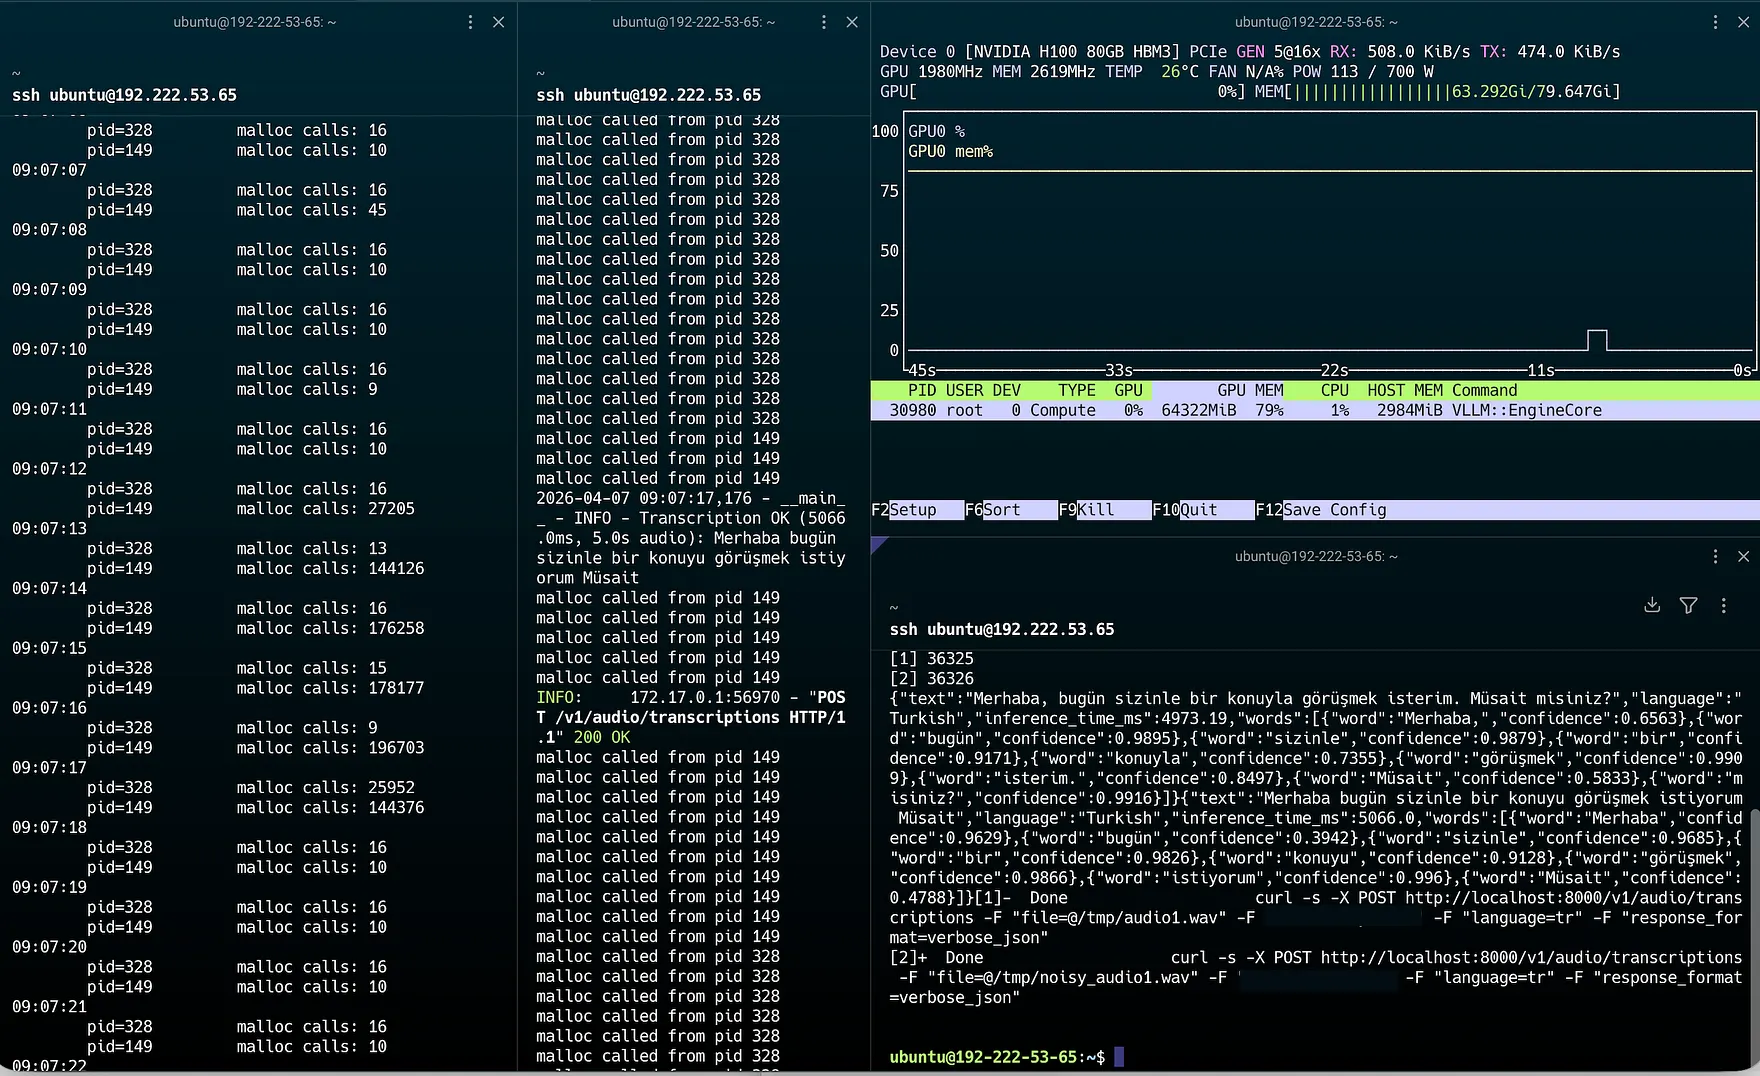
But why does it take 5 seconds instead of ~2.5?
I would say... Let's be mindful that this model is an STT. That means almost none of the 2.3 seconds is spent on the GPU. What I mean is that the pipeline looks roughly like:
- curl sends the audio file
- FastAPI receives file, decodes wav
- VAD segmentation + feature extraction (CPU)
- Tokenization + tensor creation (CPU)
- Actual inference on GPU (which bpftime + nvidia-smi confirmed takes very little time)
- Convert result to JSON, send back (CPU)
That means if two requests arrive at the same time (vLLM's engine processes requests through a single scheduling loop, so CPU-heavy stages serialize):
Request 1: [----CPU work----][GPU][CPU]Request 2: [......wait......][----CPU work----][GPU][CPU]Your first reaction to the slowness would be thinking about getting a bigger GPU. Forget about that (well, a bigger GPU possibly comes with a bigger CPU and that would help in reality, but this is not what I am mentioning :D) And see how bpftime shows this because memory allocation happens on the CPU side.
Can you guess what will happen when there are 5 concurrent calls?
Test 7: 5 Concurrent Requests
After seeing 2 concurrent take 5 seconds each, as an intelligent creature, odds are you also expected 5 concurrent to be even worse, right?
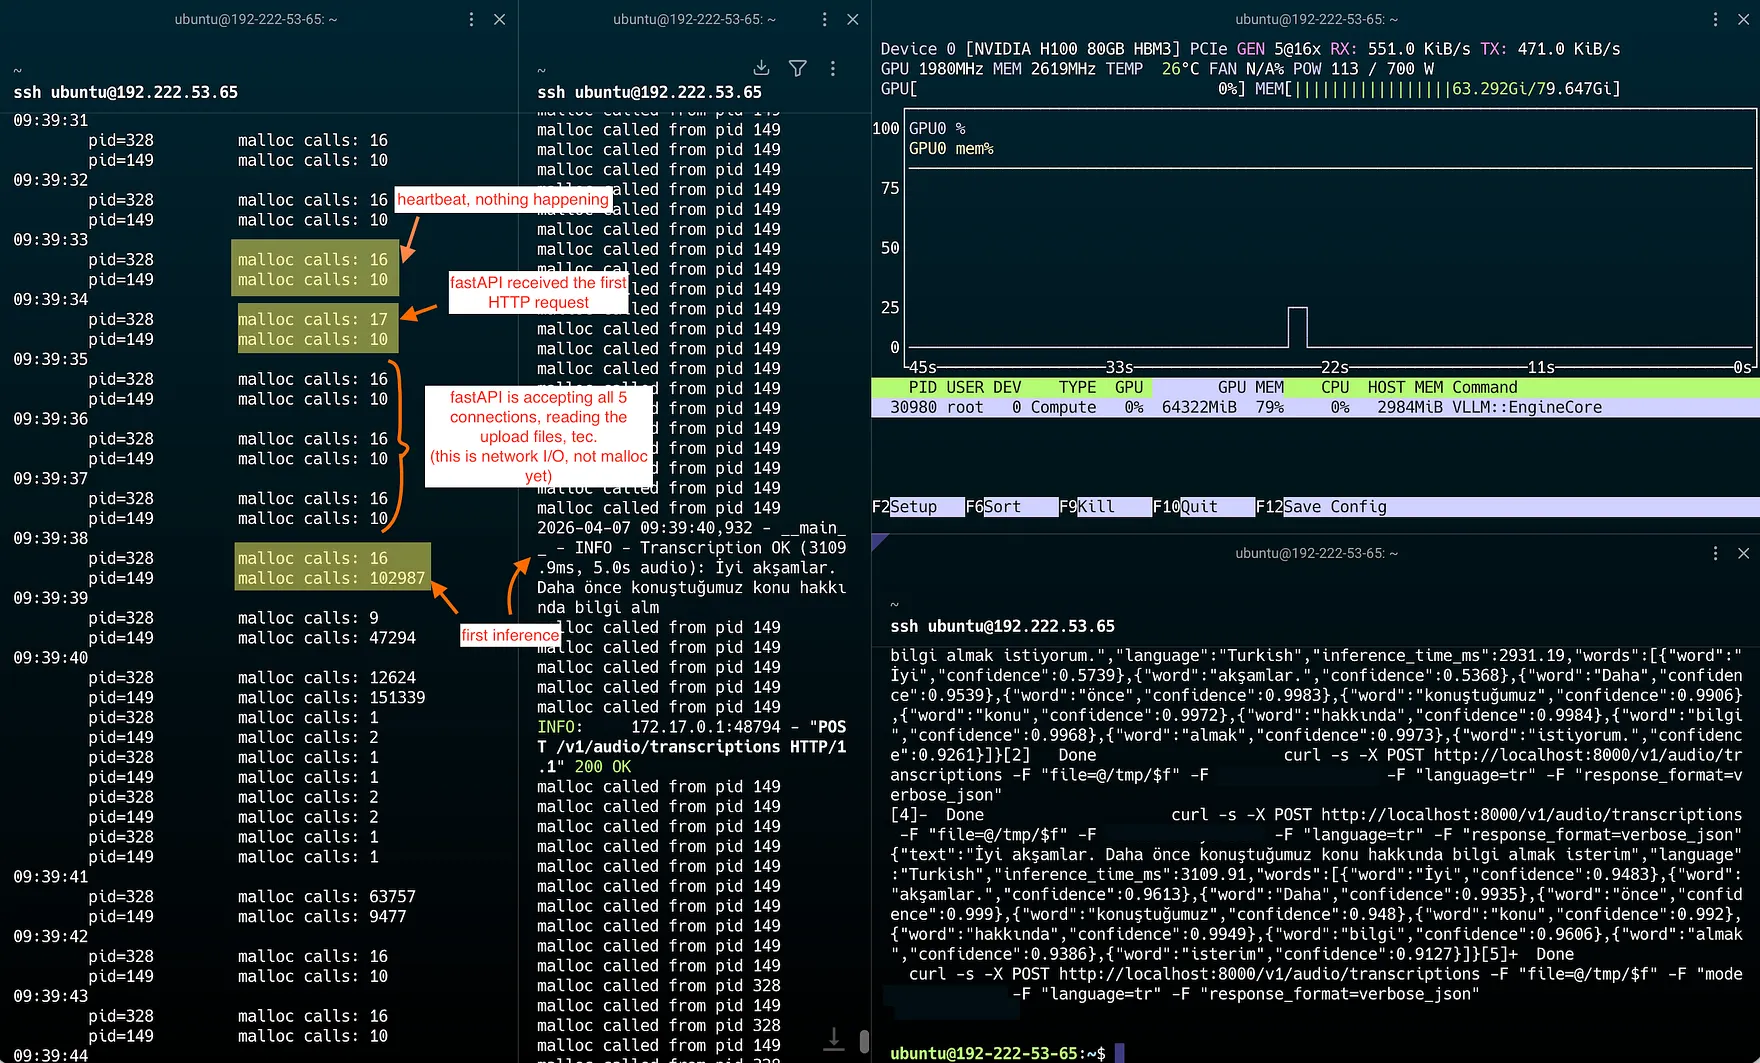
At 09:39:40, both processes dropped for a moment (queue draining and refilling), then resumed at full speed.
5 concurrent requests took ~3 seconds each. That's faster than 2 concurrent (5 seconds each).
How? With more requests in the queue, vLLM can overlap CPU preprocessing of one request with GPU execution of another, and batch the GPU steps together via continuous batching. The combined effect of this pipelining is that per-request latency drops even though the workload is mostly CPU-bound :D
And of course, by tracing memory allocations, we saw how FastAPI is also a real source of CPU load.
But What Does nvidia-smi Say?
Yes, I had the urge to execute nvidia-smi dmon alongside a single STT request during the experiment.
gpu pwr gtemp mtemp sm mem 0 126 35 42 0 0 0 126 35 42 0 0 0 133 35 42 0 0 ← request arrives 0 126 35 42 0 0SM utilization: 0%. Memory utilization (bandwidth, not VRAM usage): 0%. The only sign of life is a 7W power bump (126W → 133W :p).
Meanwhile, bpftime recorded 14,117 malloc calls from the vLLM engine in the same second.
Test 8: Here comes the TTS
When I moved from STT to TTS profiling, the TTS container couldn't start for 15+ minutes.
I found the cause: the eBPF program was using bpf_printk, which outputs debug text on every single malloc call. Remember that we saw 40K+ malloc/s during model loading?
That's 40K print operations per second going through Docker's json-file log driver...
SEC("uprobe/libc.so.6:malloc")int do_count(struct pt_regs *ctx) { u32 pid = bpf_get_current_pid_tgid() >> 32; bpf_printk("malloc called from pid %d\n", pid); increment_map(&libc_malloc_calls_total, &pid, 1); return 0;}I removed bpf_printk and kept only the map:
SEC("uprobe/libc.so.6:malloc")int do_count(struct pt_regs *ctx){ u32 pid = bpf_get_current_pid_tgid() >> 32; increment_map(&libc_malloc_calls_total, &pid, 1); return 0;}It turns out that this is a well-known eBPF principle but I missed it. So: bpf_printk is for debugging, maps are for production.
| Version | STT model load | STT inference | TTS model load | |---------|---------------|---------------|----------------| | No bpftime (baseline) | 53s | ~65ms | ~3 min | | With bpf_printk | 97s (+83%) | ~93ms (+43%) | 15+ min (I wasn't patient enough to wait for the exact loading time, so I gave up at 15.) | | Map only | ~55s (+4%) | ~67ms (+3%) | ~3 min (normal) |
After fixing the bpf_printk issue, I traced a single TTS request (In Turkish, "Merhaba, bugün hava çok güzel" → WAV):
14:34:22 pid=241 malloc calls: 16 ← idle pid=1 malloc calls: 2014:34:24 pid=241 malloc calls: 56,192 ← SPIKE pid=1 malloc calls: 169,58714:34:25 pid=241 malloc calls: 16 ← back to idle pid=1 malloc calls: 20That's 12x more than STT's 14,117/s (because its pipeline is more complex). And its response time: 493ms.
| Metric | STT (1 request) | TTS (1 request) | |--------|-----------------|-----------------| | Peak malloc/s (main) | 14,117 | 169,587 | | Response time | 93ms | 493ms | | GPU SM utilization | 0% | 0% | | Power spike | +7W | +16W |
Another observation:
Before profiling the performance, let’s do a process discovery in TTS container.
- What is the host PID of the container's main process?
PID=$(docker inspect -f '{{.State.Pid}}' tts)echo "$PID"- What processes and threads exist under that process?
pstree -ap "$PID"Here is the process tree of TTS container:
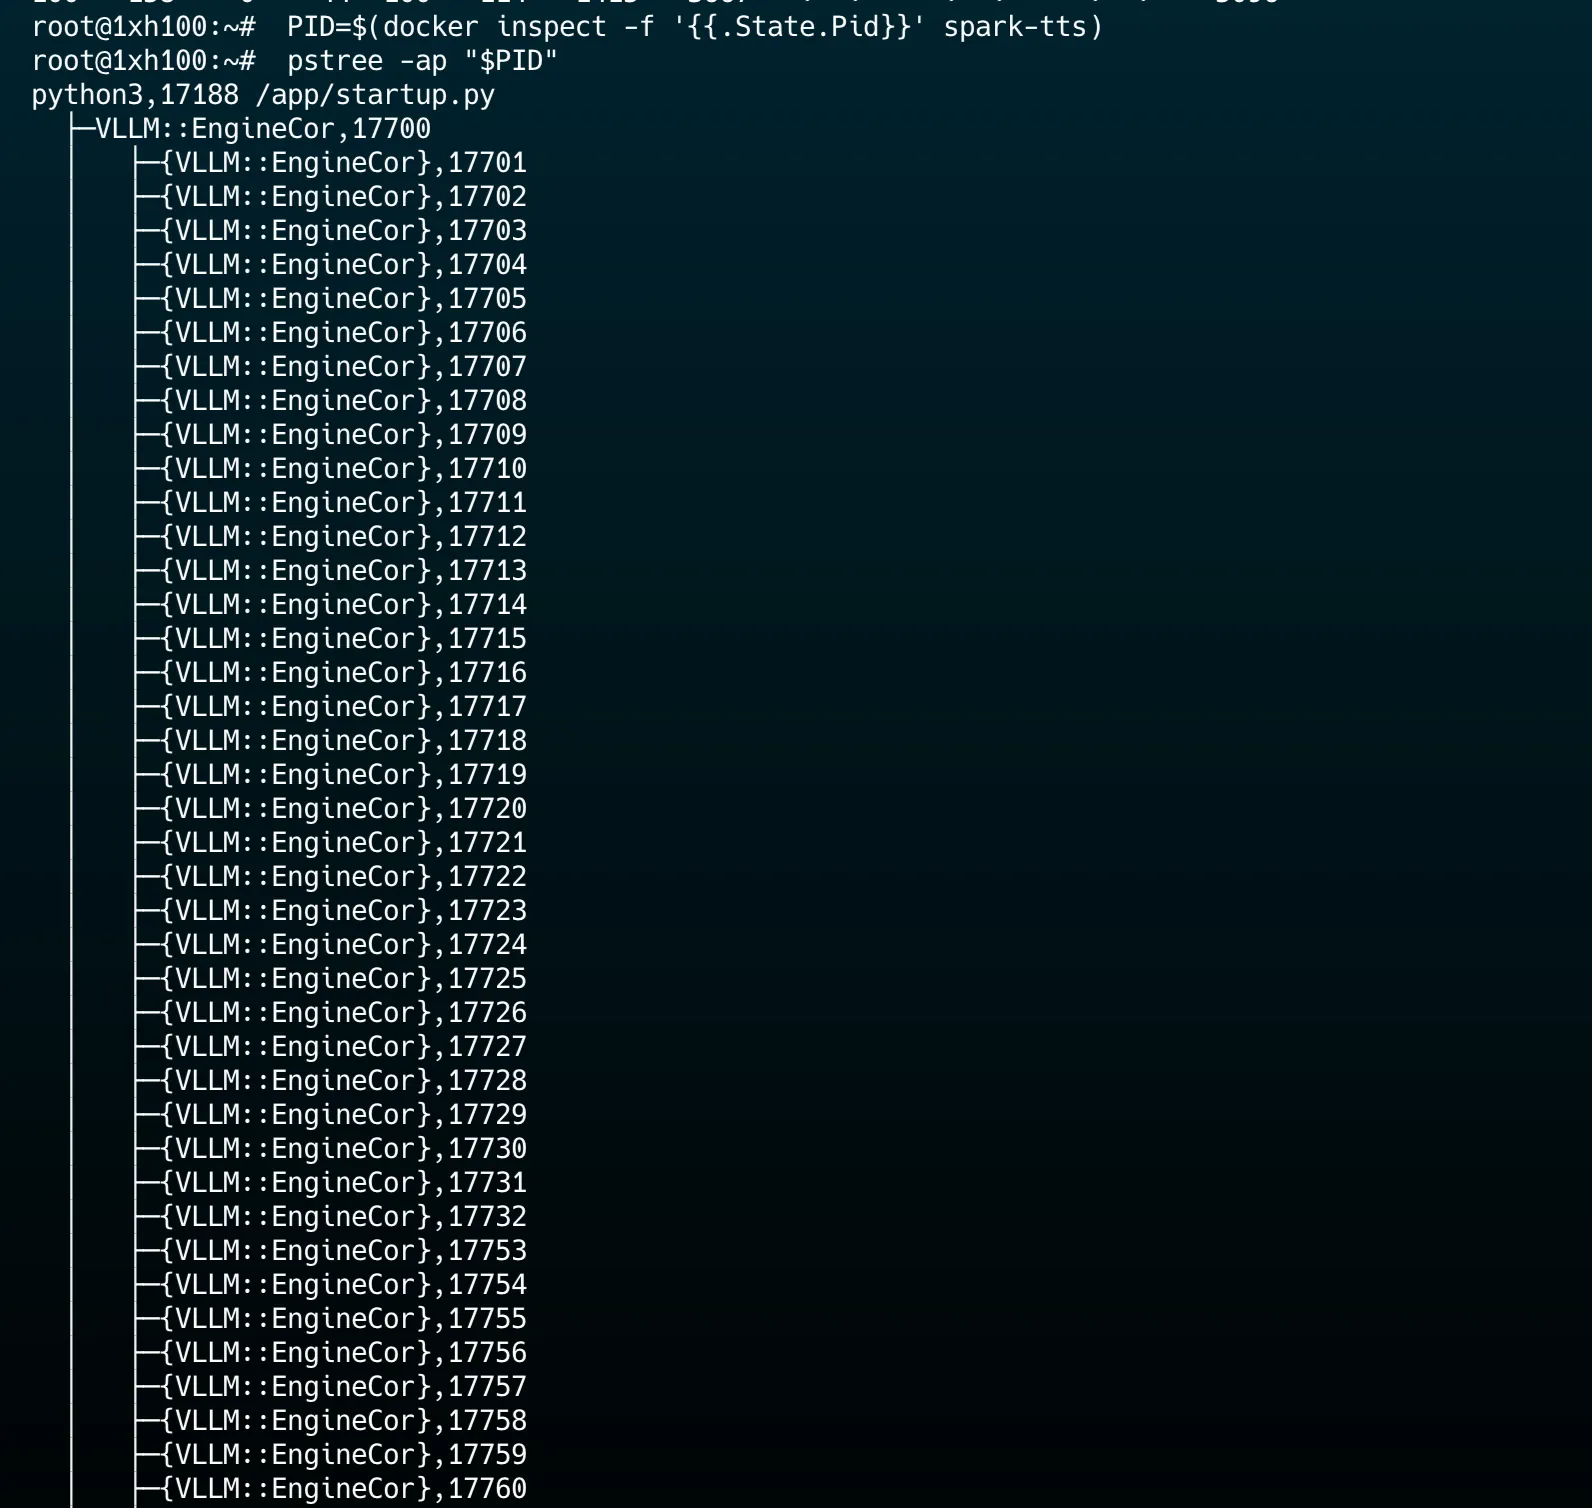
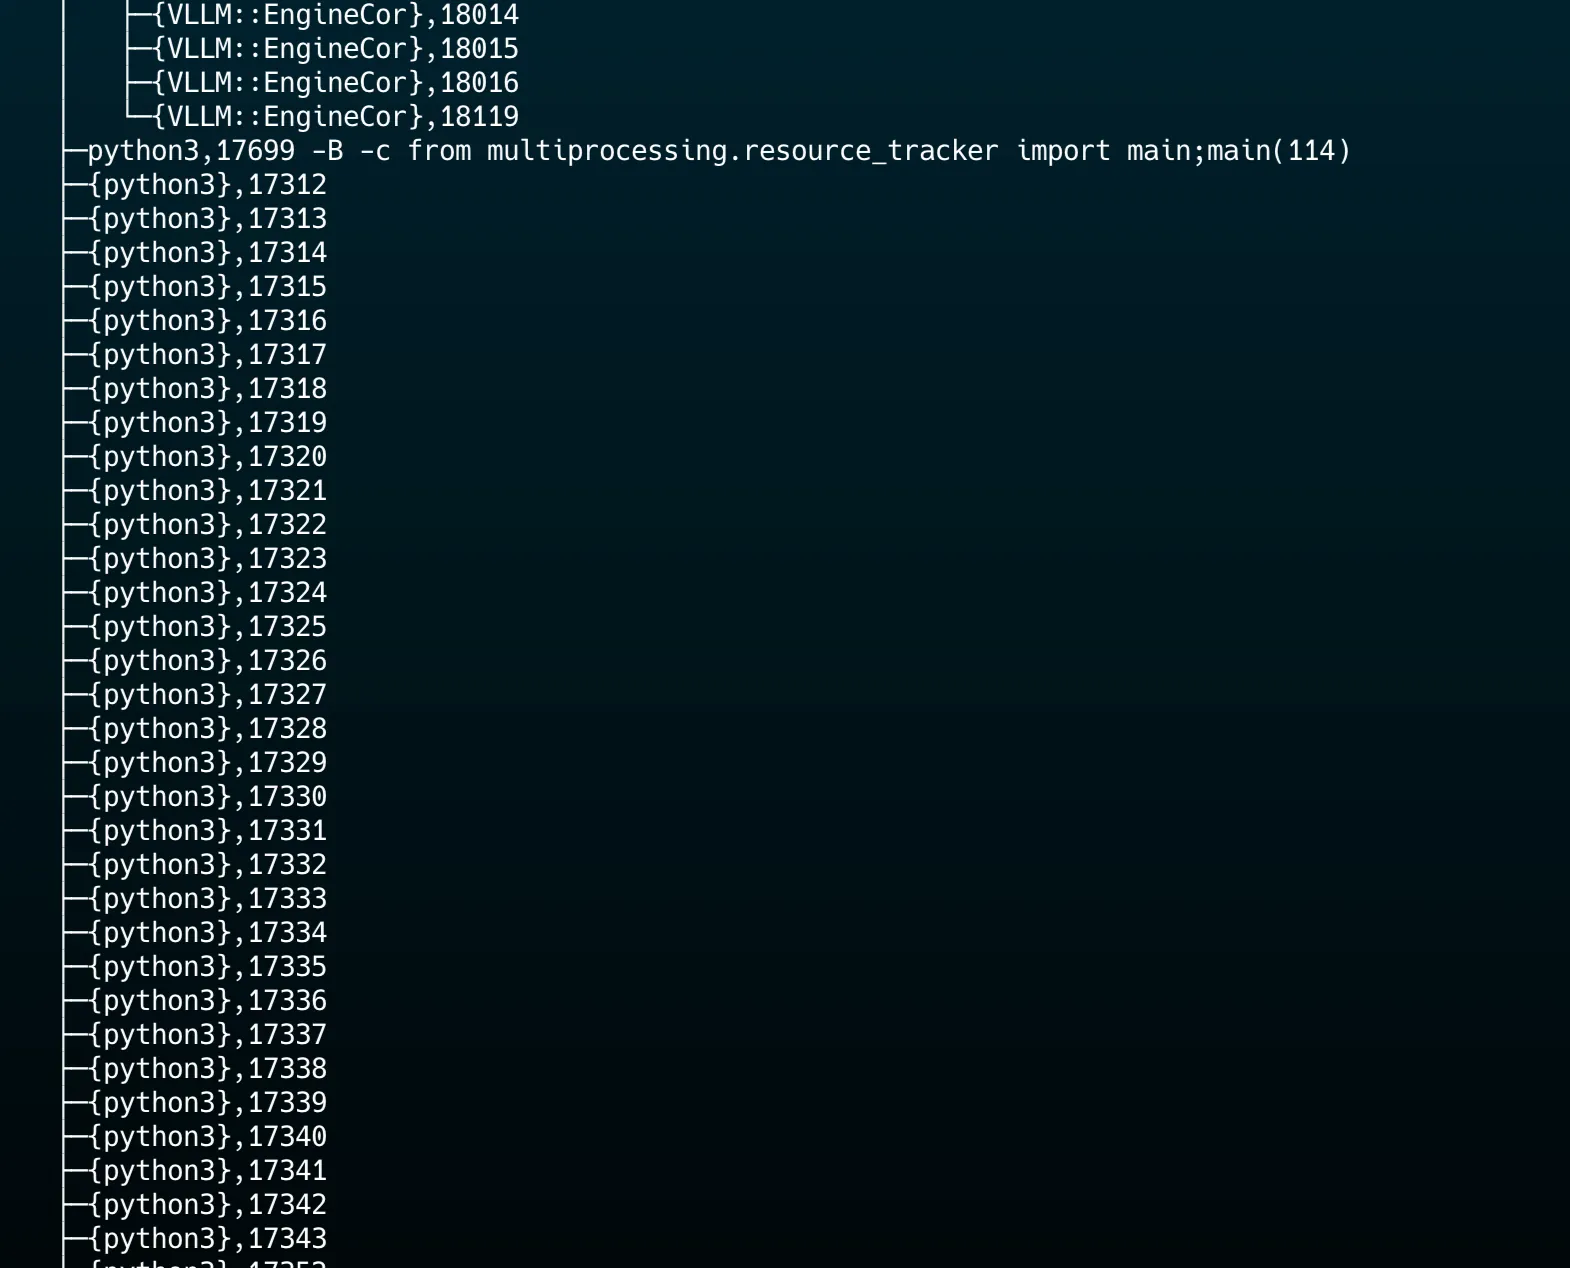
So, the service was not a single Python execution context: it split into a main API process and a separate vLLM engine-core process, each with many worker threads under.
Instead of checking container-level metrics, tracing process-level metrics is more helpful since container-level metrics are not detailed enough and it hides the real execution structure. Because if you only look at container-level CPU + memory + GPU utilization, you cannot tell which process is
- busy
- allocating memory
- launching CUDA kernels
- blocked
What bpftime Can Do Beyond malloc
bpftime actually supports other things, too:
-
CUDA API Tracing: regular uprobes on
libcudart.sofunctions likecudaLaunchKernel,cudaMalloc,cudaMemcpy. These are CPU-side calls again, so no GPU instrumentation needed, same technique as what we did for malloc but on a different library. And this one tells us exactly how many kernel launches and device memory allocations happen per request. -
GPU Kernel Probing (I can see that it is stiil experimental): bpftime has research-stage support for injecting eBPF into CUDA kernels via PTX transformation. If you are interested, early benchmarks from the bpftime paper.
What Platform Teams Can Learn from This
- Profile before you scale. Traditional observability dashboards would fool us completely with 0% SM utilization during inference. Don't buy bigger GPUs for CPU-bound workloads.
resources: requests: cpu: "4" # for STT-like cases, increase CPU, not GPU memory: 8Gi nvidia.com/gpu: 1 limits: cpu: "8" memory: 16Gi-
Concurrency behavior is non-linear. I wasn't expecting to see 5 concurrent calls faster per-request than 2 concurrent calls. With more requests queued, vLLM can overlap CPU and GPU stages more efficiently. (and maybe...set your HPA CPU threshold lower so it scales out sooner, giving you more total pods and more concurrency through load balancing.)
-
Monitor malloc patterns as a health signal.
-
In production, use maps, not printk. Collect data via eBPF maps, and read them periodically.
So, yes, I personally liked bpftime a lot! Now I have an understanding of how to track which process is busy, how many allocations there are per second, and when the batching kicks in.
References
- bpftime is the tool I used for memory allocations in this post
- NVIDIA CUDA Graphs Programming Guide
- vLLM: Easy, Fast, and Cheap LLM Serving
- LD_PRELOAD Trick is how we injected bpftime without rebuilding the container